Facebook KPIs – An Overview
Facebook KPIs have been an important topic of discussion among social media managers over the years. Many of these discussions relate to how to best track these KPIs as well as the intricacies of understanding the data provided by Facebook.
Because of this, the purpose of this article is to give you a better idea of the most important KPIs related to your Facebook page, whether it is for your personal or business profile. With a comprehensive understanding of KPIs, you can get a better sense of how to improve your Facebook page’s performance.
KPIs for Facebook: The Top 10 you Should Know
Our list will begin with the more straightforward KPIs that are relatively easy to understand and track, and then move to the more complicated ones. The objective is to provide transparency to these KPIs so social media managers can better assess their progress.
However, before we begin, we should note that there are free tools available to monitor, track, and analyze their Facebook pages and posts. These can help improve the efficiency and efficacy of your social media monitoring.
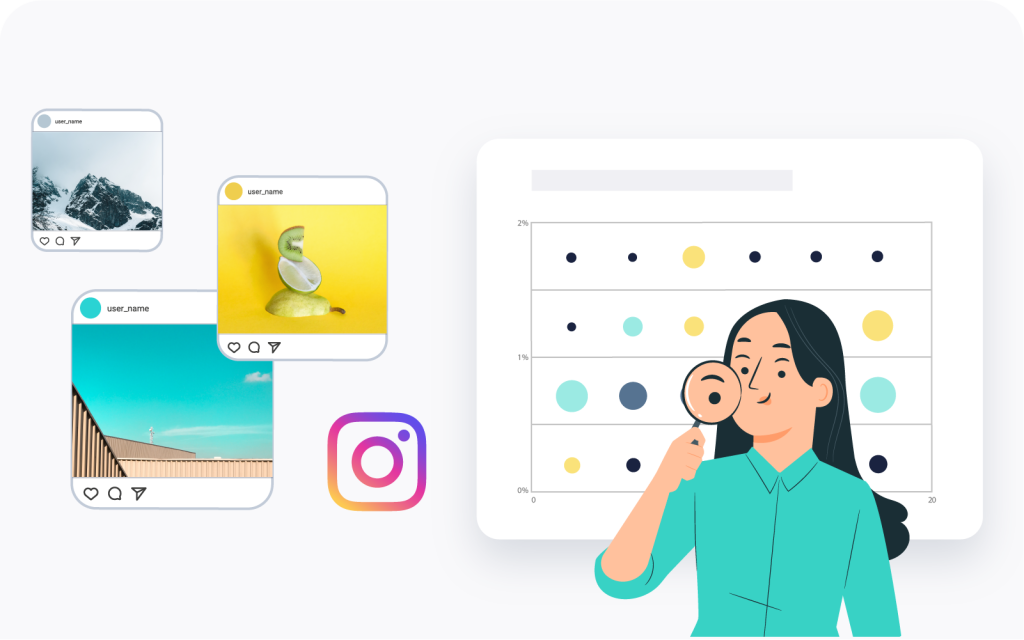
1. Reach: Determining your Profile’s Visibility
Facebook page reach is a topic that is commonly discussed, but it may not always be fully understood. So what exactly is reach on Facebook? Simply put, reach refers to the number of unique users who have seen your content on their feed. However, you should not confuse reach with impressions (which we will discuss next). You also may hear some talk about organic reach on Facebook and wonder what this means exactly. Facebook organic reach means people seeing your posts or context without using ads.
We should also point out that reach may be discussed in some different contexts. For example, might be wondering what is post reach on Facebook, rather than just referring to it as “reach.” In this case, post reach Facebook is the number of people who see one individual post.
While the questions “what is Facebook reach” or “what does reach mean on Facebook” are relatively simply to answer, the way it is calculated by Facebook requires a bit more explanation. There is no formula used relating to how to calculate reach on Facebook. Rather, reach is a number provided by Facebook itself.

If you believe Facebook’s calculation, reach then is a trusted metric about how many people have “seen” a post. However, you should approach this with a bit of caution when reporting on these figures, since “seen” does not mean that is “read”. Facebook relies on the fact, that the content is delivered to users, either in the stream or through ads directly. It remains a significant question which percentage of users actually “see” all the messages, let alone read them.
2. Impressions: Measuring a Post’s Exposure
Impressions are simply how many times a post ends up in someone’s feed. What is important to realize here is that even if a post ends up in the same users feed on multiple occasions, each one will be included in the impression count. Importantly, if you are running ads on Facebook and are wondering how many impressions your ad received, you can obtain this data directly from Facebook.
While impressions are probably not the only KPI you should concentrate on, it is helpful for understanding how many times your post or ad shows up in feeds and is possibly seen. It can also help you understand when the best times to post may be to increase the number of times your posts show up in feeds.
Now that we have defined what impressions are, it is also important to highlight the difference between Facebook impressions vs reach. In this case, the preliminary difference lays in impressions merely concerned with appearances in a feed, while reach is how many people see a post.
3. Posts Per Day: Optimizing Frequency
Posts per day is a very straightforward KPI and is simply the average number of posts that you make a day over a give time period. The usefulness of this KPI is to find the ideal number of posts you should make on a daily or weekly basis that maximizes, for example, user engagement.

It can also be helpful to conduct a benchmarking analysis of posts per day (or even per week) related to your competitors in a specific industry. This type of analysis could be focused on finding how many posts per day is ideal for maximizing engagement rates. A best time to post analysis can be conducted with the use of a social media tool for benchmarking.
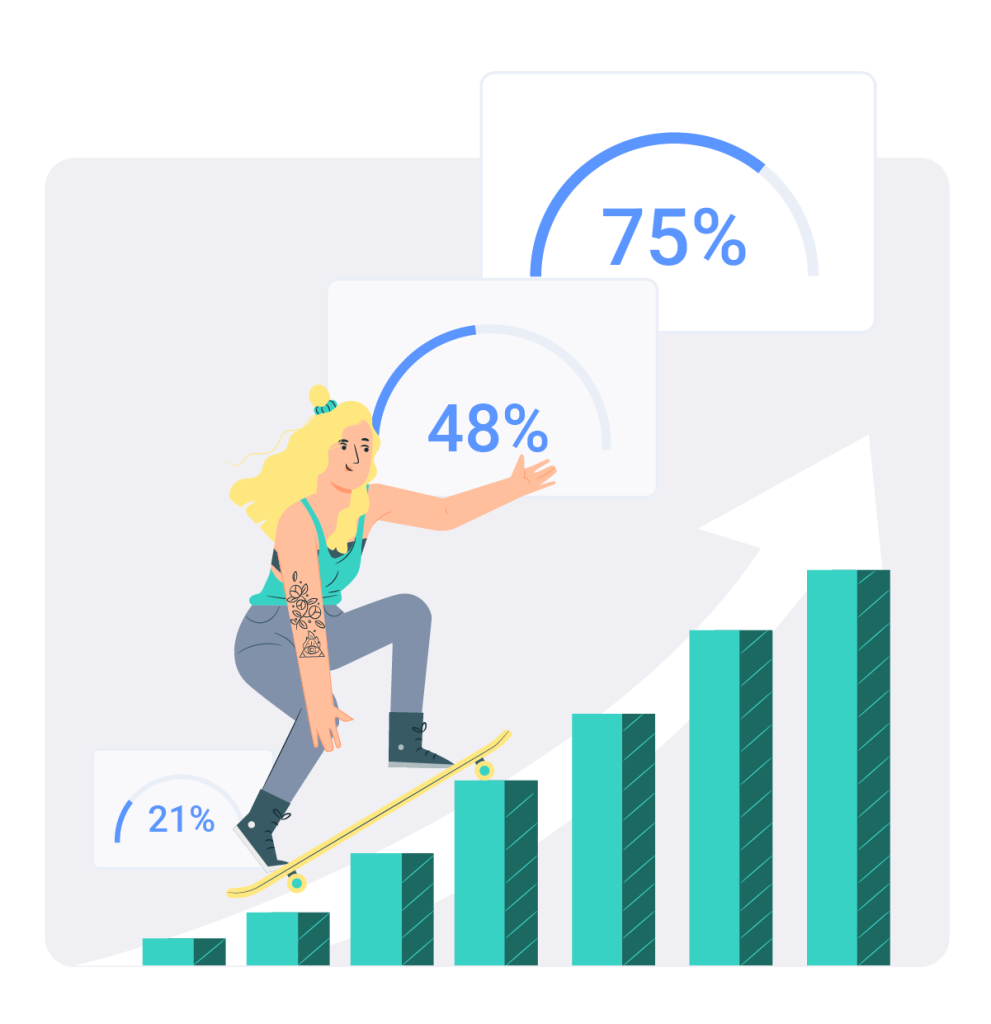
4. Follower Growth: How Fast you Increase your Follower Count
The total number of followers is a straightforward Facebook KPI. It indicates the total number of users who follow your profile. Follower Growth, on the other hand, tracks the increase, or decrease, in your follower count over time. Follower growth can be a useful KPI in understanding if your content and posts are effective at growing your audience in a given time period.
It is fairly simple to calculate your follower growth rate and you can use this formula:
[(Number of current followers – number of followers at start of specified start period) / number of followers at start of specified period] * 100
However, the primary question relates to choosing a give time period that you are interested in. If you choose a shorter period, let’s say a three-month period where you posted new content often, you can gain helpful insights about how that specific content helped your growth rate. Alternatively, you can look at it in the longer term, perhaps a one-year period, to see how your activities have helped growth your follower numbers for a longer time period.
5. Engagement: Quantifying User Interaction
Follower engagement rate for a Facebook page is a crucial KPI for many companies. For this KPI to provide helpful information to social media managers, they must first understand exactly what is Facebook engagement is and how to find the engagement rate on their Facebook page. But what does engagement exactly mean on Facebook?
Engagement rate on Facebook includes tracking interaction with your content, whether it is likes, comments, or shares in relation to the number of followers or impressions. Understanding Facebook posts’ engagement rate is key to determining the effectiveness of your content, since it shows you if your content is engaging and spurring interaction among followers. In this sense, the difference between Facebook reach vs engagement is that reach is simply who sees your post and engagement measures the rate at which your audience likes, comments, or shares of your posts.
So, how to calculate engagement rate on Facebook? The formula for engagement rate on Facebook is:
(total engagement / total reach or impressions) * 100%
Rather than looking online for a Facebook engagement rate calculator or using a manual calculation, it is advisable to use a social media tool that can calculate engagement rates instantly and help you benchmark them against competitors.
6. Post Interaction Rate: Understanding User Response
Post interaction rate and engagement rate may seem like synonymous terms, but are, in fact, different. Post interaction rate focuses on interactions per individual post and reflects how effective individual posts are at spurring interactions. Similar to engagement, actions such as likes, comments, or shares can be considered as interactions.
Post interaction rate can give you another way to look at the effectiveness of your content that is different from simply the engagement rate of posts on your social media profile.
7. Response Time: How Fast you Respond to Comments
If your company or brand has a Facebook page, then chances are that many of your followers may be your customers. In some cases, they may ask questions, have comments, or lodge complaints through your Facebook page. To accurately assess your social media team’s performance, we recommend tracking response time. A response could count as making a comment on a thread, deleting a comment from a user, or even something as simple as a like.
Response times tell you how long does the Facebook page needs in responding to a post. Since most companies do have people monitoring their social media 24-hours a day, 7-days a week, you should not expect to reach average values of less than 10 minutes. Similar to the posts per day, you can get familiar with this indicator by comparing yourself to your competitors.
In making sure your response times are as low as possible, it is generally advisable to use a social media community management tool to help you manage comments and the needs of your customers. This is especially true if you have multiple social media accounts across different channels and a number of social media or community managers needing to work efficiently together.
8. Traffic to Website: Measuring Social Media Lead Generation
For many businesses, a Facebook page may play a key role in driving traffic to your website. Posts that have highly engaging content with links to your website’s landing pages can increase overall traffic and, hopefully, conversations. One of the primary ways you can measure the effectiveness of your Facebook page in driving traffic to your website is through click-through rate (CTA). Basically, click-through rate will tell you how many times someone clicked on the link in relation to overall impressions of the post.
You can calculate your click-through rate as follows:
(Clicks / Number of Impressions) * 100
Google Analytics can be used for tracking this KPI for you. If you are interested specifically in how individual posts with a link are driving traffic to your site, then it is advisable to use a UTM code in your URL parameters. This will allow you to determine where the traffic coming from a particular post. Additionally, there are also social media monitoring tools that can measure your click-through rate and provide you with advanced analytical insights related to this metric in relation to others.
9. Advertising Value: Calculating Your Cost Per…..
KPIs for Facebook ads revolve around finding out what you get in return for your ad spend. Clearly, tracking ad KPIs is essential for crafting effective Facebook marketing strategies. However, this can be done a few different ways depending on your campaign’s goals.
The core question for social media managers running Facebook ads is how much money it costs to reach a specific goal. For instance, how much does it cost you to generate, an impression, click, or conversion.
Below are the formulas that you can use in calculating how much an impression, click, or conversion costs for a specific campaign.
Cost Per Impression: You can measure this with the following formula
Cost of Campaign / Impressions
Generally, you would measure the cost per 1000 impressions, so the once you know the cost per impression, you can simply multiply by 1000.
Cost Per Click: You can calculate how much each click costs with this formula:
Cost of Campaign / Clicks
Cost Per Conversion: Ultimately, companies want to increase their conversions.
Cost of Campaign / Conversion
You can look at all three of the different Facebook advertising KPIs above, or only one. It depends on what the objective of your campaign is and what you would like to get out of your campaign spend.
10. Sentiment Analysis: Understanding your Audience Reactions
Sentiment is a much more qualitative analysis than the other Facebook KPIs listed above, and there is much more debate about how accurate it can truly be. At its core, sentiment analysis involves looking at how your audience reacts to your posts and social media activity and whether it is positive, negative, or perhaps even somewhere in between. The key question then is how would one go about measuring sentiment.
One way to conduct sentiment analysis on Facebook is to analyze the comments or reaction on a specific post or even an entire profile and put in categories such as positive, neutral, or negative. Once you add up all the responses and categorize them into one of the three response types, you can calculate the average for each category. For instance, you may find that a post received a positive response 65% positive of the time, while only having a 10% negative reaction.

Additionally, we could approach sentiment analysis for an entire profile. However, in many cases, there are hundreds or more posts to go through. What is the solution? In this case, it would make sense to identify your posts that have the highest post interaction rates and select a certain number of those for analysis. Then you could conduct a simple positive, negative, or neutral analysis of the comments or reaction as explained above. This would provide a good idea of your audience reactions with a bigger data set that you would get just from one post.
One subject we should also mention here is using a tool to help you analyze sentiment. Although there are some good sentiment analysis tools available, content that includes, for instance, irony and sarcasm are still hard to detect for machines. Even though sentiment analysis is fascinating and helpful, the KPI output can, at times, be too vague or requires relatively expensive tools that have limits on how many insights they can give you.
A Final Tip: Look Closely at your Facebook KPIs
Being a Facebook expert means understanding the in-depth details of KPIs and what they tell you. For instance, amateurs may think that the questions “What does Facebook reach mean?” and “What does post reach mean on Facebook?” are actually the same. However, experts understand that they are actually are different since one focusing on individual posts and the other focuses on the reach of a profile in general during a specific timeframe.
Knowing the intricacies around KPIs is not irrelevant. For example, social media managers must understand how to accurately calculate cost per reach on Facebook to present projections and results of their campaigns to company stakeholders. In order to make sure you are communicating the value of your efforts and why it matters, you have to have a strong foundation of knowledge about Facebook KPIs.
Tracking Facebook KPIs with a Social Media Tool
If you want only the basics, and if you have only one social media account without much activity, then you may not need a social media tool. However, if you are looking for more in-depth insights, especially for cross-network ones, as well as the ability to track and analyze historical data on your performance, then a social media tools are absolutely essential.
A comprehensive social media tool can profoundly enhance your understanding of Facebook KPIs, providing more nuanced insights and actionable data. Unlike the basic metrics provided by Facebook’s analytics tool, social media tools can provide you with a much better understanding of what type of content and posts are working, which ones are not, as well as when the best times to post are (or aren’t!).

After reading this article, you know, for instance, how to calculate Facebook reach and what it means. But what a social tool can help you with is to get a full range of insights with how reach relates to post interactions or engagements.
Another example relates to Facebook post engagement, and measuring the effectiveness of your content. You really don’t need a social media tool to tell you how to find Facebook engagement rate. This is because you can simply use an engagement rate calculator for Facebook to get what you need. However, social media tools exist to help you get more out of your data and can take the analysis of your KPIs to the next level. A quality social media tool can provide you with data that shows you what time to post that reflects days and times that generally have higher engagement rates.
Calculate KPIs for your own Facebook Page for Free
At this point, you may want to start expanding your social media analysis and benchmarking capabilities. Fanpage Karma offers a free plan for those wishing only to analyze their Facebook account!
If you want to see all the benefits of using Fanpage Karma, you can take advantage of a 14-day free trial. During this free trial, you can analyze unlimited social media profiles across different channels as well as try out the publishing, reporting, and influencer discovery features.
You can also take our Facebook performance score test. It is completely free and provides you with not only an overall score, but also recommendations with how you can improve the performance of your Facebook page.
The Best Times to Post on Twitter

The Best Instagram Hashtags
The 2024 European Elections on Social Media
How to Increase your Twitter Engagement Rate
The Best Times to Post on Facebook