Which Hashtags are your Competitors Using?

Let’s start off with an important point about the focus of this article. In most cases, social media managers are not so much concerned with which hashtags their competitors are using in general, but rather which hashtags are helping their competitors or industry peers succeed. The essential question for social media managers, then, is finding out what is working for their competitors regarding hashtags, or to learn what didn’t work for their competitors. In order to do this, you need to learn about researching hashtags for your social media activities.
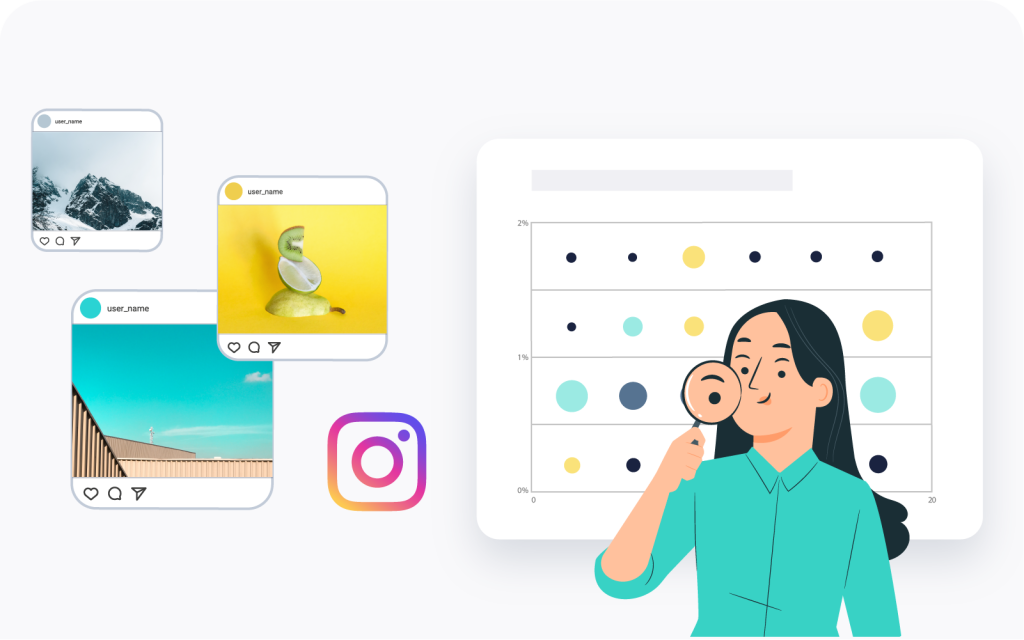
Social media hashtags are often used as a means to join a particular debate or trend. For this reason, using the right hashtag can be beneficial for your business in order to extend reach or increase engagement. Social media hashtag research can help you gain insights into what is currently trending in your industry or to show you how your competitors are trying to use hashtags in order to get noticed.
We should mention, though, that companies and individuals use hashtags all the time with varying results. As a social media manager, you may want to get a leg up on the competition and learn from their successes, or mistakes, which is done, of course, with hashtag research. However, the hashtag research might not be quite as straightforward as you think.
In this article, we will show you how to research hashtags to not only find out what hashtags other similar businesses are using, but also what hashtags you should consider using in your posts. This will be done with a special focus on the process you can use to discover what hashtags may help your social media performance. At the end of the day, you want your hashtag research to help your post perform better and we will show you how.
How to Research Hashtags for Social Media Posts: A Step-By-Step Guide
You may be wondering how to actually do hashtag research. In reality, hashtag research requires a number of coordinated steps that ensure you are collecting and analyzing data that is helpful for your business. These steps include determining what social media channels and timeframes you are interested in, what other profiles will make up your data set, and how to analyze and understand the data you accumulate.
Hashtag research for small businesses is a similar process, but one thing to keep in mind is to pay close attention to what types of companies you are using for benchmarking purposes. For instance, it may not make sense to use large retailers as a part of your analysis if you are only running a single small store. The key to using hashtags for business growth is to understand who your audience is and to make sure your content aligns with the content you are producing.
With that being said, learning how to conduct research hashtags is something that every business, no matter what size, can do. One thing that you will need is a hashtags research tool that allows you to do advanced analysis. Other than that, learning how to research hashtags for social media posts is as easy as following the 6 steps below.
Step 1: Decide What Social Media Channels you are Interested in
Pretty much all the most popular social media channels allow for the use of hashtags when you post. These hashtags are used as tags to help highlight topics, conversations, or trends that are similar. However, even though hashtags are relevant for many social media channels, the first step in understanding how to research hashtags is to define which channels you are interested in for your analysis.
There are a few points you should note when thinking about this step. As we will discuss in our section about interpreting the results of the hashtag analysis, looking both at cross-channel and inner-channel hashtags may result in interesting insights. This is because some, or many, of your posts may be similar across your social media channels and there could be similar hashtags used on more than one channel. Are there hashtags that you can use on, for instance, Twitter and Instagram? Or, if you are focused on one channel, can you get a leg up on your competition by tailoring all your hashtags to a particular social media platform?
We should point out, though, that you can also create multiple charts that look at cross-channel hashtags as well as those that focus on hashtags for one specific channel, such as Twitter and Instagram. This can help you understand the performance of hashtags on individual channels or cross-channel.
Moreover, when researching hashtags, you should also be aware that collecting data of hashtags used on social media channels that you don’t use also may not provide helpful insights for you and can even skew the data you collect. It is always important to understand where your data comes from and what this means for the conclusion you draw from it.

Step 2: Identity your Competitors and/or Industry Peers
The next thing to consider when thinking about how to research hashtags for social media posts relates to what competitor profiles should be added to your data set. This is because researching hashtags that your competitors or other industry peers are using is particularly helpful. In this way, you can effectively learn from them whether it be from their successes or failures. This saves you time and effort since you do not have to go through the same trial and error process that they might have gone through.
However, to learn from your competitors or industry peers, you need to identify who those companies, brands, or individuals actually are. In determining who you should identify as a competitor or industry peer, be sure to keep in mind it is generally best to choose companies or brands that have similar social media followings or ones that actually work in your market.
If, for instance, you are an American company only operating in the United States, it may not make much sense to use a German company operating exclusively in Germany as an industry peer, even if they work in the same industry. Additionally, if you are looking for hashtags for your small business, you should look predominately at other similarly sized companies in your area or region.
If you are looking to add competitors industry peers to your list that perhaps you haven’t heard of, there are some approaches you can use to search for them. For one, you can use discovery tools to find out which other profiles are out there. Sometimes, you can also use social media channels themselves. For example, on Instagram, you can type in a word into the hashtag search to see which profiles are using it. It may, in fact, help you find interesting profiles you didn’t know about yet.
In order to give you a better idea on how to find out what hashtags your competitors are using, let’s pretend we are a global chocolate and candy producer. For our proposes going forward, we will select the following brands for our hashtag research and analyze them with our hashtags research tool: Hershey’s, Lindt and Reese’s, Twix, Toblerone, and Kinder Bueno. These are major companies in the chocolate industry and, thus, the focus will be mostly on finding suitable chocolate hashtags for them to use in their posts.
Step 3: Create a Dashboard of Profiles for your Analysis
Before going on, we should bring up an important point. Hashtag research is theoretically possible without a tool. However, you will find that this is extremely time-consuming, difficult, and ultimately will severely limit the types of insights you can get. Hashtags research tools are great at helping you to identify the way in which hashtags related to KPIs and metrics. This can give you a leg up on expanding your social media reach and visibility.
Once you have a list compiled of competitors and industry peers, you can move on to collecting historical data related to the hashtags of your competitors and industry peers to help you find out what hashtags they use and what hashtags correlate to higher reach, engagement rate, etc.
With this list, you should do is create a dashboard that contains all the profiles of your competition. The grouping of your industry peers on the dashboard will not only allow you to gain insights related to competition hashtags in your industry, but will provide a whole host of other insights about how you compare to these profiles. This can help you confirm that you analyzing the correct competitors. Below, you see an example dashboard from the all-in-one social media tool, Fanpage Karma.
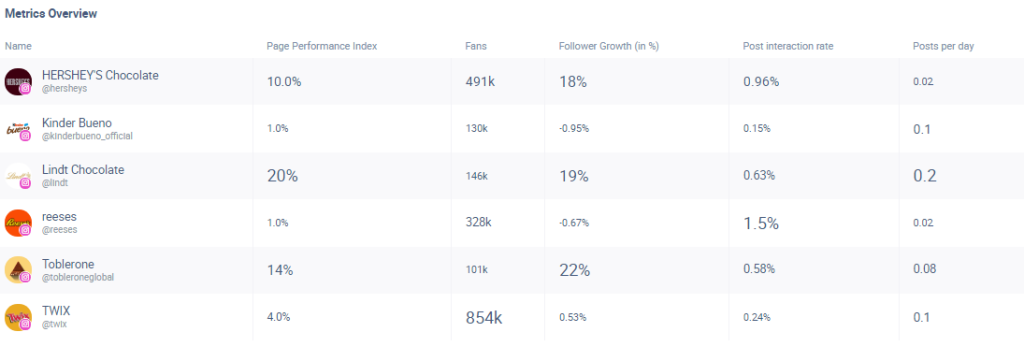
In our example dashboard above, we limited ourselves to only one channel: Instagram. However, if your tool allows for unlimited profile tracking, there is no limit to how many channels and profiles that you can track.
Step 4: Choose your Benchmarking Metric(s)
Social media hashtag research is more about what your competitors are using, but should a WHY you are interested. In other words, what do you want to accomplish in gaining more information about hashtags. For instance, are you most concerned with which hashtags have the highest post interaction rates associated with them? Or, do you only care about what hashtags are being used the most often by your competitors so you don’t miss out on a hot trend?
With your social media tool that allows you to analyze hashtags, you can get an overview from one or more metrics in relation to hashtags used. For instance, many social media managers are most interested in the relationship with hashtags to high engagement or post interaction rates. However, you can also look into something simpler, such as which hashtags are the ones being used the most or least often. If you find hashtags with relatively strong post interaction rates but are not being used that often, then these would be low competition hashtags that may be a good option to use in your posts.
One last thing to mention here is to understand that correlation is different from causation. There are, of course, many other things that relate to engagement or post interaction rate, such as the quality of content and knowing what type of content your audience is looking for. However, the insights gained from hashtag research may provide helpful in giving your content a leg up on the competition.
Step 5: Choose your Timeframe: Different Times, Different Hashtags?
Once you have created a dashboard, you need to specify what timeframe you are interested in for your analysis. Like many things on social media, some hashtags may quickly go out of style. However, there is also a possibility that a specific hashtag is used effectively over a long period of time. In beginning your hashtag research, it is important to understand the different timeframes you may be interested in based on your social media strategy. By changing the timeframe of your analysis, you can assess the effectiveness of hashtags at different times of the year.
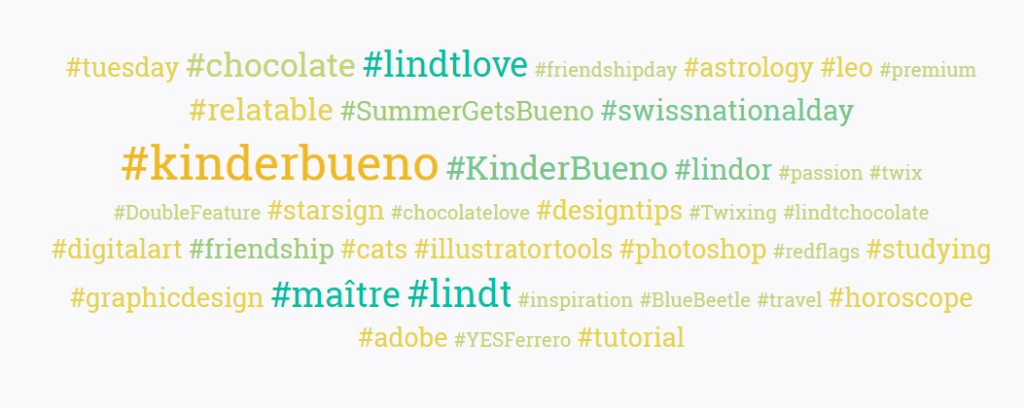
Let’s look at an example. Below, we can study two charts that include hashtags used across 5 social media channels (Facebook, Twitter, Instagram, Tiktok, and Youtube) and for the 6 brands we mentioned above (Hershey’s, Lindt, Reese’s, Twix, Toblerone, and Kinder Bueno). The two charts below were generated with Fanpage Karma’s hashtag analysis function.
In this example, we are interested in two metrics: 1) how often a hashtag was used during a particular time period and 2) the post interaction rate associated with that hashtag. In the chart, the bigger the font size, the more often a hashtag was used. The greener a word is, the more reactions were given to posts with that hashtag. The goal is ultimately to find hashtag ideas for your business that are driven by your data analysis and have the potential to get your post more visibility and interactions.
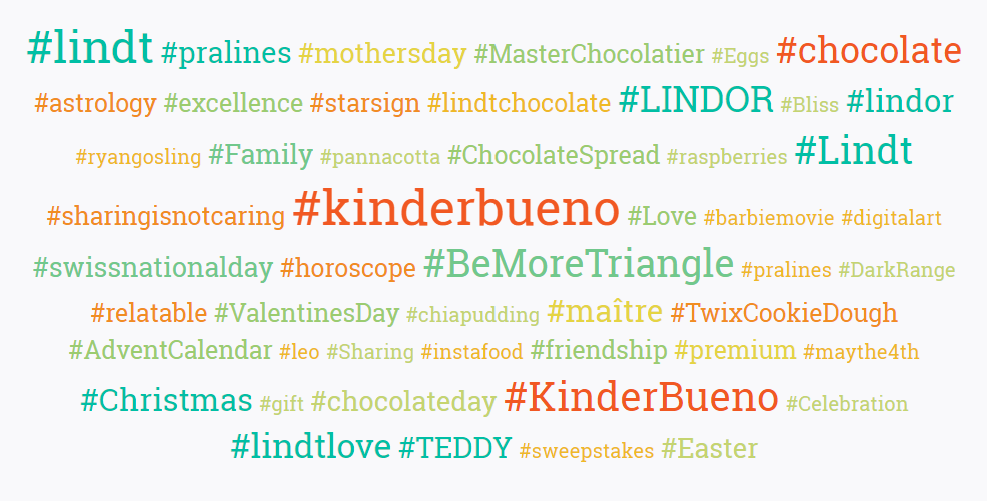
Time Period: August 2022 – August 2023

Time Period: August 2023
We will talk more about analyzing our results soon, but just from this example, we can see the differences that a timeframe can make in showing the popularity of a hashtag and its correlation with a particular post interaction rate. While there are some similarities, such as the use high use of, and relatively low interaction with, the #kinerbueno hashtag, we can also see that the year-long view provides a much more extensive list of hashtags that were used across these social media channels. This may prove helpful in finding the right hashtag for business growth if you are promoting, for example, a new product during a specific time period.
Step 6: Analyze your Results
Once you have created your dashboard and have an idea of all the channels and timeframes you want to look at, you can start analyzing your results. As we pointed out earlier, we are using Fanpage Karma to conduct our hashtag research and analysis, so we will be sharing the different charts and graphs that display our results.
There are two primary things we want to do in this section when it comes to social media hashtag research. First, is to show the different ways you can look at your data and what it is telling you. The second is how you can experiment with different social media channels and timeframes to give you a more comprehensive view of hashtags.
For our example, we will mostly be concerned with post interaction rates for posts and, therefore, we are interested in what hashtags are correlated with higher post interaction rates.
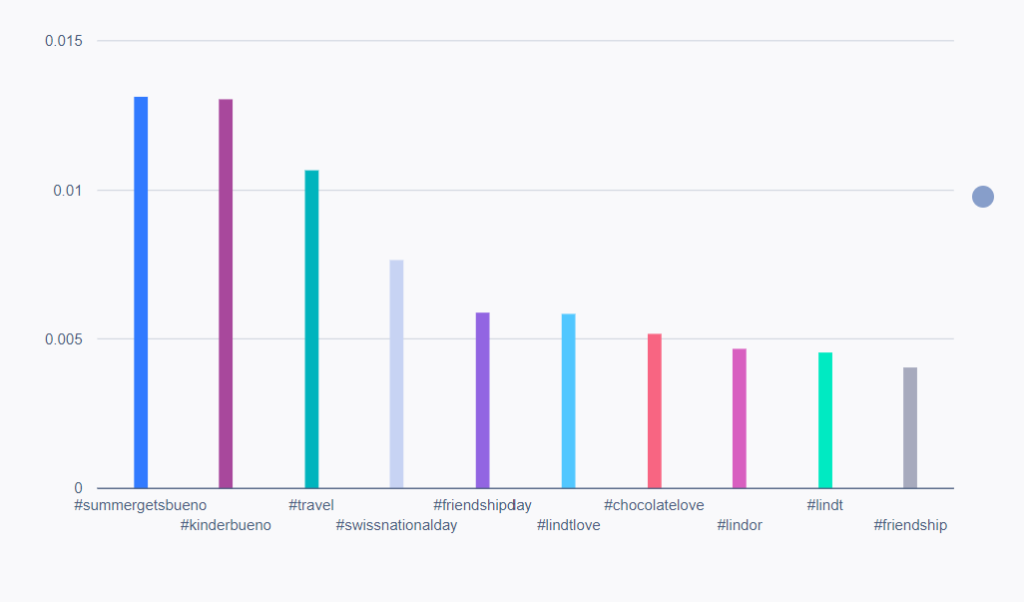
Let’s start off with a quick look at the different ways you can present and analyze your data. In the first example below, we have a word chart similar to what we have seen above. As was the case with the charts above, the larger the word, the more often that hashtag was used, with the greener representing a high engagement rate. The second example is a bar chart for the same time period, but focusing only on post interaction rate.
Time Period: August 2023
Time Period: August 2023
In this example, this presents data in two different ways, with the bar chart taking out consideration of the frequency a hashtag is used. This may be one way to look at data to simply and persuasively show what hashtags are correlated with a specific post interaction rate while focusing only on the top 10 hashtags for this metric.
Let’s look at another example that that compares two different time periods (August 2023 and December 2022) for only one channel: Instagram.
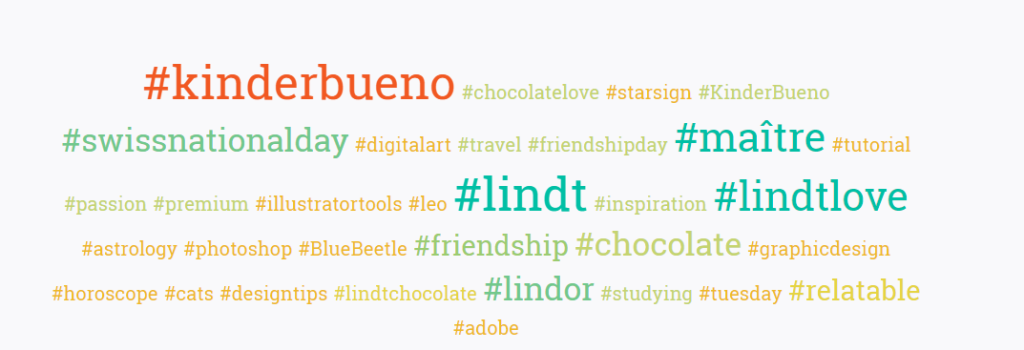
Time Period: August 2023
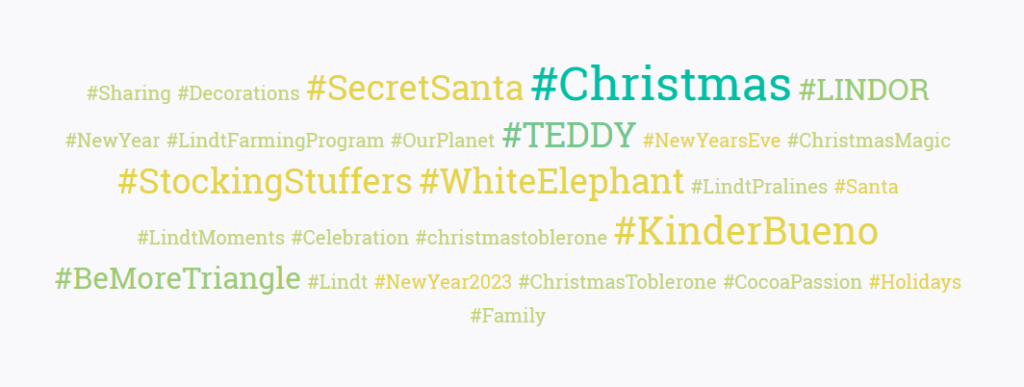
Time Period: December 2022
You see what may be helpful this summer, but also what may be coming up to help you with your overall social media strategy for the Christmas holiday. As you can see, looking at the data on a per-month basis gives you a much more precise understanding of hashtags used in a relatively short period of time for only one channel.
The advantage of this analysis is that we can get helpful insights that are channel-specific, without the data from other channels involved. The one possible downside is that since many companies post similar content across channels, there could be potentials that are not seen only by looking at data from one channel.
One thing to note here is the qualitative analysis potentials as well. For example, when you are using the Fanpage Karma tool, you can click on a hashtag and the posts that used that specific hashtag in the time period you indicated will then appear. This provides a more qualitative basis for your analysis and perhaps can give you some hashtag ideas for your business based on the content associated with those hashtags that is produced by your competitors.
With your hashtag analysis, you want to study your data from various perspectives by looking at different time periods, social media channels, and metrics. For this reason, creating several charts is an important way to analyze your data. In this way, you can take study different data sets from multiple competitors or industry peers throughout various time periods. You can use this data alongside your own analysis of your own hashtag performance to find the best strategy for the future.
You may also find low competition hashtags that don’t get used that often but may be correlated with, for example, high post interaction rates, which may be why you create a bar chart (as seen above) with only post interaction rates. The important point in creating different charts that reflect different timeframes or correlations to different KPI metrics is that you can then start to look for patterns and learn from them.
One final thought associated to hashtag analysis relates to determining what hashtags are used for direct competition and ones that are unique for you or your competitors. Seeing that a competitor’s branded hashtag has a high interaction rate may not be particularly helpful for your own uses. When thinking about competition hashtags, it may be helpful to look more exclusively at hashtags that you and your competitors would both use and determine how best to craft engaging content related to those hashtags.

Hashtag Research for Every Business
Social media hashtag research isn’t rocket science. However, it does take time to analyze and interpret your hashtag research to derive helpful information for your social media activities. Moreover, it almost always requires the use of an effective hashtag research tool to accumulate and present your data in intelligible ways.
If you are interested in conducting hashtag research with Fanpage Karma as we showed above, then try our 14-day free trial. There is no credit card needed and you can sign up for your free trial in seconds to do hashtag research as well as powerful features for analysis, publishing, and community management.

The Best Times to Post on Twitter

The Best Instagram Hashtags
The 2024 European Elections on Social Media

How to Increase your Twitter Engagement Rate
The Best Times to Post on Facebook