


TOP 10 KPI Selection
- Number of Fans The number of fans is the most well known of all the figures and it’s publicly available for each fan page. However, the significance of this KPI is limited. The number of “inactive fans”, who were attracted by competitions but are not interested in the content of the page or simply purchased fans reduce the meaningfulness. For use in comparisons and benchmarking with other sites, the number of fans is also not optimal. Better suited for this is in. ..
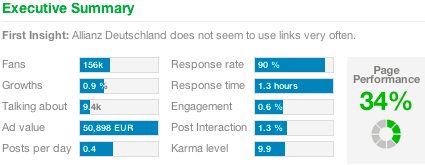
- Growth The growth measures the increase of the number of fans in a given period. It is advisable to look at a slightly longer period to compensate for unique effects. Like the Total Number of Fans, the growth of the fans says nothing about the quality of the page. For average growth rates view our latest study here.
- Talking About Talking About is a value provided by Facebook. It is publicly available if you click on the number of fans on fan page. It indicates how many users have interacted in the past seven days with a specific Facebook page. Interactions include likes, comments, shares, votes or events, check-ins, etc. But it also includes the number of new fans. Talking About is a rough indicator of activity, but as a KPI for your own performance rather unsuitable: The mix of interaction and new fans hinders you from making deductions. Furthermore, the number of fans can be manipulated by e.g. buying friends. Talking About is provided by Facebook with delay and is only available three days late. For comparing two pages, it is suitable only if the pages have the same number of fans and grow at the same speed.
- Engagement Fan Engagement with a Facebook page is crucial. You need to measure how much the fans interact with the page. The Engagament not only tells you how well the Social Media Manager knows how to connect with the Facebook community and how well the content is accepted by the fans, but it is also the basis for the Edge Rank algorithm. This algorithm is used by Facebook to determine how interesting a post is for a Facebook user. And based on that, whether the user gets to see the post at all. Unfortunately, Facebook does not have a direct KPI for engagement. Therefore you would have to add up all interactions in a given period. As a very rough measure the following trick can be applied: Divide the Talking About value by the number of fans. The result is an approximation of how well the page is able to activate fans. By no means is it an ideal solution, as the Talking About has major drawbacks as described above. Moreover, it does not measure the number of interactions but the number of people who have interacted. This results leads to underestimation of engagement in vibrant communities. Often, the value of “Talking About / Number of Fans” is called “percentage of active fans.” That’s just wrong. The users counted in Talking About are not necessarily fans. They might be users who interacted once or by accident and might never be seen again. The quotient of Talking About and Number of Fans is therefore only a “quick & dirty” solution and a rough estimate of Engagement. It is not useful as a reliable indicator. To determine the involvement of a fan page, you have to either grab your calculator or you can use one of many social media monitoring tools. Just like Fanpage Karma calculates the Engagement, Post Interaction and Karma value that reflects the Engagement, most of the other tools available present similar values – but not always for free. For average engagement rates view our latest study here.
- Reach Reach is provided by Facebook for every post of your own page and as a total for your own fan page as the sum of the last seven days. If you believe Facebook, it shows how many people have “seen” a post. This figure is to be used with extreme caution. “Seen” is definitely not “read”. Facebook relies on the fact, that the content is delivered to users, either in the stream, in the advertising column or news ticker on the right. It remains a big question which percentage of users actually “see” all the messages let alone read them. Especially in the news ticker that keeps on running even if you are not at your computer or in a different browser tab. Generally speaking, we recommend to look at the reach with great skepticism.
- Posts per day This metric shows how actively the fan page produces content. An optimal post frequency does not exist. A company in the B2B might get better Engagement rates with rare and high-quality contributions whereas a comedian or a news site might be able to post many times a day. We recommend you to benchmark with similar sites in the same industry or category. Generally, one can assume that it could be favorable to post at least once per day.
- Service-Level and Response Time One important feature of fan pages is that fans can post on the timeline of the company. It can be questions but also complaints, wishes or spam. Regardless of the type, a reaction of the fan page is expected in any case, even if it is just deleting the post. With the KPI “Service Level” we measure the rate of posts from fans which the page has responded to. Either by liking, commenting or deleting. Especially for larger fan pages, this can be a real challenge. But a service level below 90% will always raise questions. The response time is a more refined analysis of the level of service: How long does the fan page need to respond to a post? Since most companies (still) do not offer 24-hour service, don’t expect to reach average values of less than 10 minutes. Similar to the posts per day you can get familiar with this indicator by comparing yourself to your competitors. There are a variety of tools to provide these figures. There are minor differences in the calculation. Some tools attempt to determine the type of post by analysis of the texts (for example, by detecting a question mark). These methods are too imprecise.
- Traffic to a homepage or blog One goal of many fan pages is to direct users to a homepage or blog. Facebook in itself, does not show very elegantly how many times links have been clicked. You have to add it all up by yourself. However, one can use other ways. On the one hand, it is possible to shorten links using an URL-shortener like bit.ly. These services also provide analytics. Another way is the classic analysis of the website or the blog via Google Analytics, Piwik or similar tools. These tools can create additional parameters which are added to the end of a link before it gets posted on Facebook. The tools can then determine which users were referred from which post on Facebook. As a third option, some monitoring tools like Fanpage Karma aggregate this KPI for you.
- Advertising Value The question of the value of a Facebook page is not trivial to answer. The value of the fan community and the direct connection to fans is hard to weigh in gold. Some well-known approaches from the traditional marketing can be applied to Social Media Marketing as well. One of them is the advertising value. Here you estimate how many people were reached through posts from the page. Now you ask: To reach as many users with traditional advertising – for example, banner ads – how much money would you have had to spend? This is derived by multiplying the number of people reached with an average CPM. With this comparison, it is possible to calculate an advertising value of posts for each fan page. No matter where you stand on such evaluations, for decision makers in companies, values in dollars are often easier to understand than interaction rates.
- Sentiment Sentiment analysis is about the mood of the fans on a whole Facebook page or in each post. To determine this, comments and posts are analyzed and put in categories such as positive, neutral and negative. The result is a quotient such as “65% positive”. Using Engagement KPIs we can only determine that a post has provoked many reactions. It can be analyzed more deeply with the sentiment analysis, telling you if the fans responded positively or negatively to certain posts. A sentiment analysis is very complicated. Although there are very good tools for this, irony and sarcasm are still hard to detect for machines. Real people are more reliable here, but they should be natives. Even though Sentiment Analysis is fascinating and helpful, as KPIs it is either too vague or very expensive.


Calculate KPIs for your own Facebook Page
And how about your fan page? Let Fanpage Karma do the hard work and calculate the most important KPIs for you. Use our KPI overview in the Free Edition at no charge. Besides that, you get tons of interesting analysis for your Page. Try it now: www.fanpagekarma.com
Infographic
