
They are part of everyone’s childhood. Who didn’t create castles made of bricks, fought battles with water guns or dreamed of being a hero while using an action figure? We all used toys. But how are these products holding up in a world were computers, smart phones and other digital devices become more and more common?
This week we analyzed some of the biggest toy manufacturers on the planet. We were anything but pleasantly surprised with what we discovered.
Lack of optimization
It’s not even a company, but a single product that has the most fans of all toy manufacturers. Barbie reigns and has 12.4M fans on Facebook. The company that comes closest is Lego (9.8M), followed by Fisher-Price (2.6M), Hot-Wheels (1.3M), LeapFrog (1.1M), Nerf (1.1M) and Hasbro Gaming (252k). The size of a page doesn’t have to do much with the companies revenue it seems.
With 0.4% per week, the pages are growing rather slowly. Lego (0.8%), Mega Blocks (0.8%), Playmobil (0.7%) and Fisher-Price (0.7%) are the only exceptions. Jakks Pacific even lost fans over the course of the last weeks. No need to panic though, it was just a fraction of the user base (-0.04%).
On average the pages publish 0.8 posts per day. Melissa & Doug try to engage their customers twice as often. 1.6 times is the amount they post on a daily basis. Playmobil almost matches them (1.5), followed by Hasbro Gaming (1.3) and Mega Blocks (1.2). All other pages can’t reach a post per day, most end up between 0.6 to 0.9.
What’s really interesting is the timeframe they publish content in.
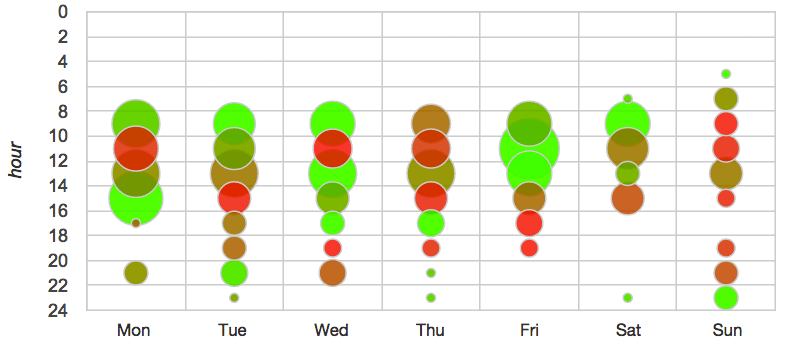
As you can see: They barely use Facebook’s option to time posts. Especially on monday almost no posts are published after 4pm, same applies for friday. Additionally, prior to lunch most of posts aren’t properly planned. A lot of potential is wasted. Especially on thursday this becomes clear. While the pages should publish most of their content between 4pm and 6pm, they do so between 10am and 2pm and fail horribly. They do a way better jobs on weekdays.
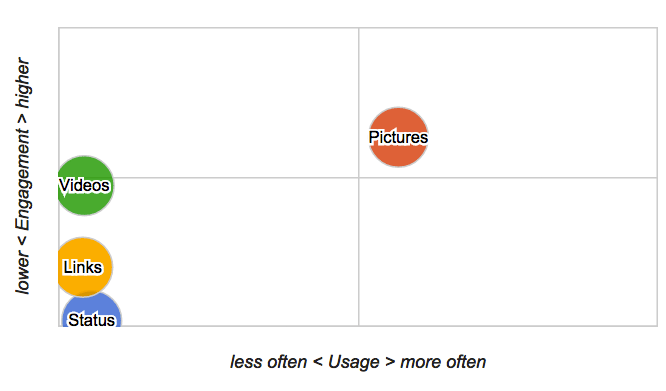
However, sunday simply seems to be a swap for content. Either post it in the evening or not at all. Most of their posts are pictures, with videos being the second most successful, and status posts the second most used medium.
The service level is decent, but nothing exceptional. The only company that does an outstanding job is LeapFrog. While the other pages responds to 55% of their users on average and need approximately 21h to do so, LeapFrog managed to reply to 99% in just 4h.
The Shell dilemma
The company we were disappointed by the most is Lego. Over two-thousand user posts in the last 28 days, but they only reacted to 23% of them. It’s worth mentioning that they did so within 1.6h, which is pretty fast. They obviously seem to care, so why did they only respond to so few of their users? The easiest explanation: they don’t know what to respond.
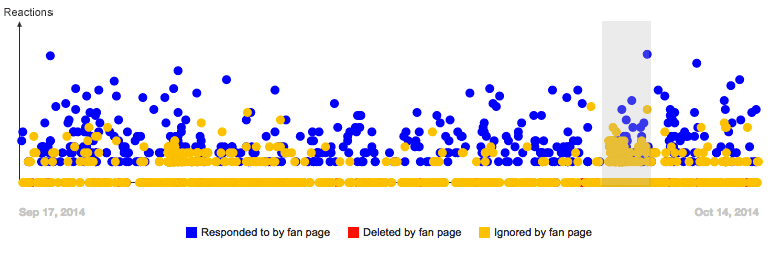
This is every single user post Lego received in the last month. A blue dot means that the page reacted to the post, a yellow one that it didn’t. Quite a few yellow ones, right? Well, most of them aren’t in English but instead written in Portuguese, Spanish and Russian. So it’s just logical to assume that the administrator simply doesn’t have the resources to respond to people in half a dozen different languages.
If the post is english, but didn’t receive a reaction it often has to do with Royal Dutch Shell. After Lego cancelled it’s promotional contract with Shell many users showed their gratitude. Almost all posts in the grayed out area are posts made by people who appreciate what Lego did. This explains why the community manager didn’t bother to respond. It would be nice if he had given the fans some feedback, but considering the amount of posts it’s not something that that should be considered mandatory. Actual questions however receive a response in almost no time.
The most successful posts are about products. Lotteries are hosted rarely. We had a really hard time trying to find one. Playmobil nets almost the entire top 25 of the most successful posts. Considering how simple their posts are that’s quite an impressive accomplishment. Here’s a couple examples:


![]()
![]()
![]()


![]()
![]()
![]()
Every picture tells a story. Maybe that’s the reason why their content is so popular. The engagement of the average page is 0.2%. Playmobil’s engagement is 1.4%. The average actually is pretty deceiving. The mean is approximately 0.055%, meaning that Playmobil manages to achieve an engagement 25 times as high as the bottom half of of the pages. Mega Blocks is ranked second with 0.1%.
Other companies should definitely follow their example. Especially Barbie and Lego could easily create similar content. Considering the tremendous success it should definitely be worth the additional time they would have to invest.
Conclusion
Manufacturers seriously need to put more effort into their posts. Playmobil is the perfect example of a company that understood what their customers like. What they do isn’t complicated. They simply analyzed their user base and found a perfect way to catch its attention.
Posting at the right time also is pretty important. This is even easier to check because it doesn’t require you to analyze every single post. You can simply use a social media tool and control if the posts you publish on the weekend are successful or not.
All calculations were made with Fanpage Karma. Fanpage Karma is an online tool used to analyze social media profiles. Users can monitor an unlimited number of Facebook pages, Twitter profiles or YouTube channels. Either their own or those of competitors. Fanpage Karma provides valuable insights on posting strategies and performance. It gives hints on how to improve engagement.
Optimize your social media strategy with Fanpage Karma right now!
Article Header under CC BY-SA 2.0 license, unchanged, from e_marga.
