
Comparing and benchmarking social media profiles is done best with charts. That’s why we added an amazing new feature to our benchmarking suite.
The new “Summary” allows you to put together a dashbaord of charts with all the information you need. For example a historic view of the development of number of fans or a ranking of pages by engagement value. You can display any metric in one of four different charts:

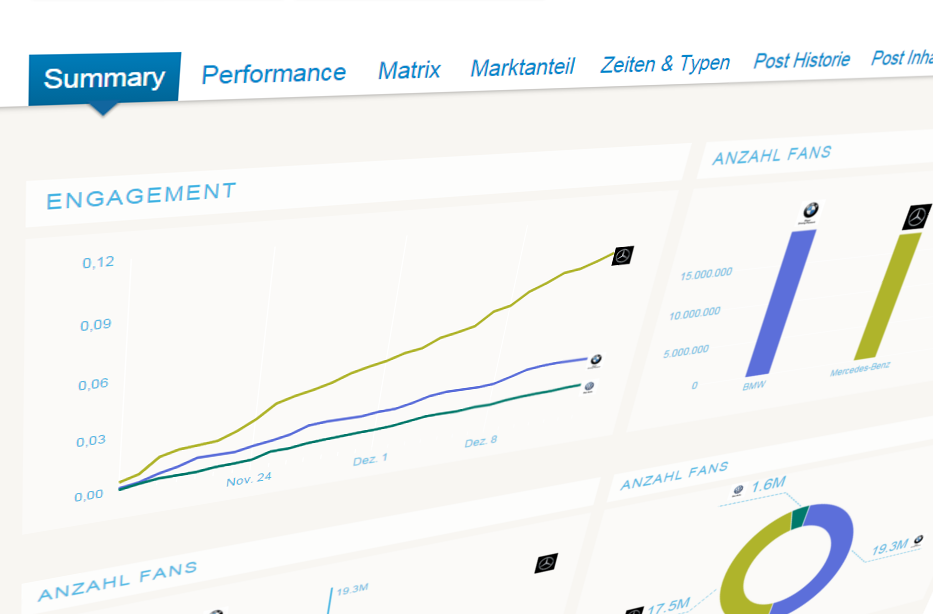
The four charts are
- Historic (Line Charts)
- Ranking (Bar CHarts)
- Share of Market (Pie Chart)
- Two-Metrics-Comparison (BCG-Matrix)
As metrics you can choose any metrics that is available in Fanpage Karma and add as many charts as you like. And even better: For each of your dashboards, you can create a different set of charts.
With drag & drop you can rearrange your summary anytime. You can also use this summary to analyze past events. Just change the time period and get the data.


TIPP: Try it out now: www.fanpagekarma.com.