

Every community & social media manager wants her Pages to be the #1 in its market segment. In order to get there you have to set clear goals, measure and analyze your progress and use your insights to constantly get better.
There are quite a few points within this process where it’s reasonable to take a good look at you competitors, certain markets or “interest groups” (profiles and Pages that bring you new ideas and inspiration). Sometimes it is even essential for example for target group analysis.
But Fanpage Karma has just the perfect tool for you. Our Benchmarking:
It allows you to apply every Fanpage Karma analysis to all pages in a dashboard. And since we don’t have any restrictions on how many pages you’re allowed to analyze, there’s nothing standing between you and some analytics fun.
For example:
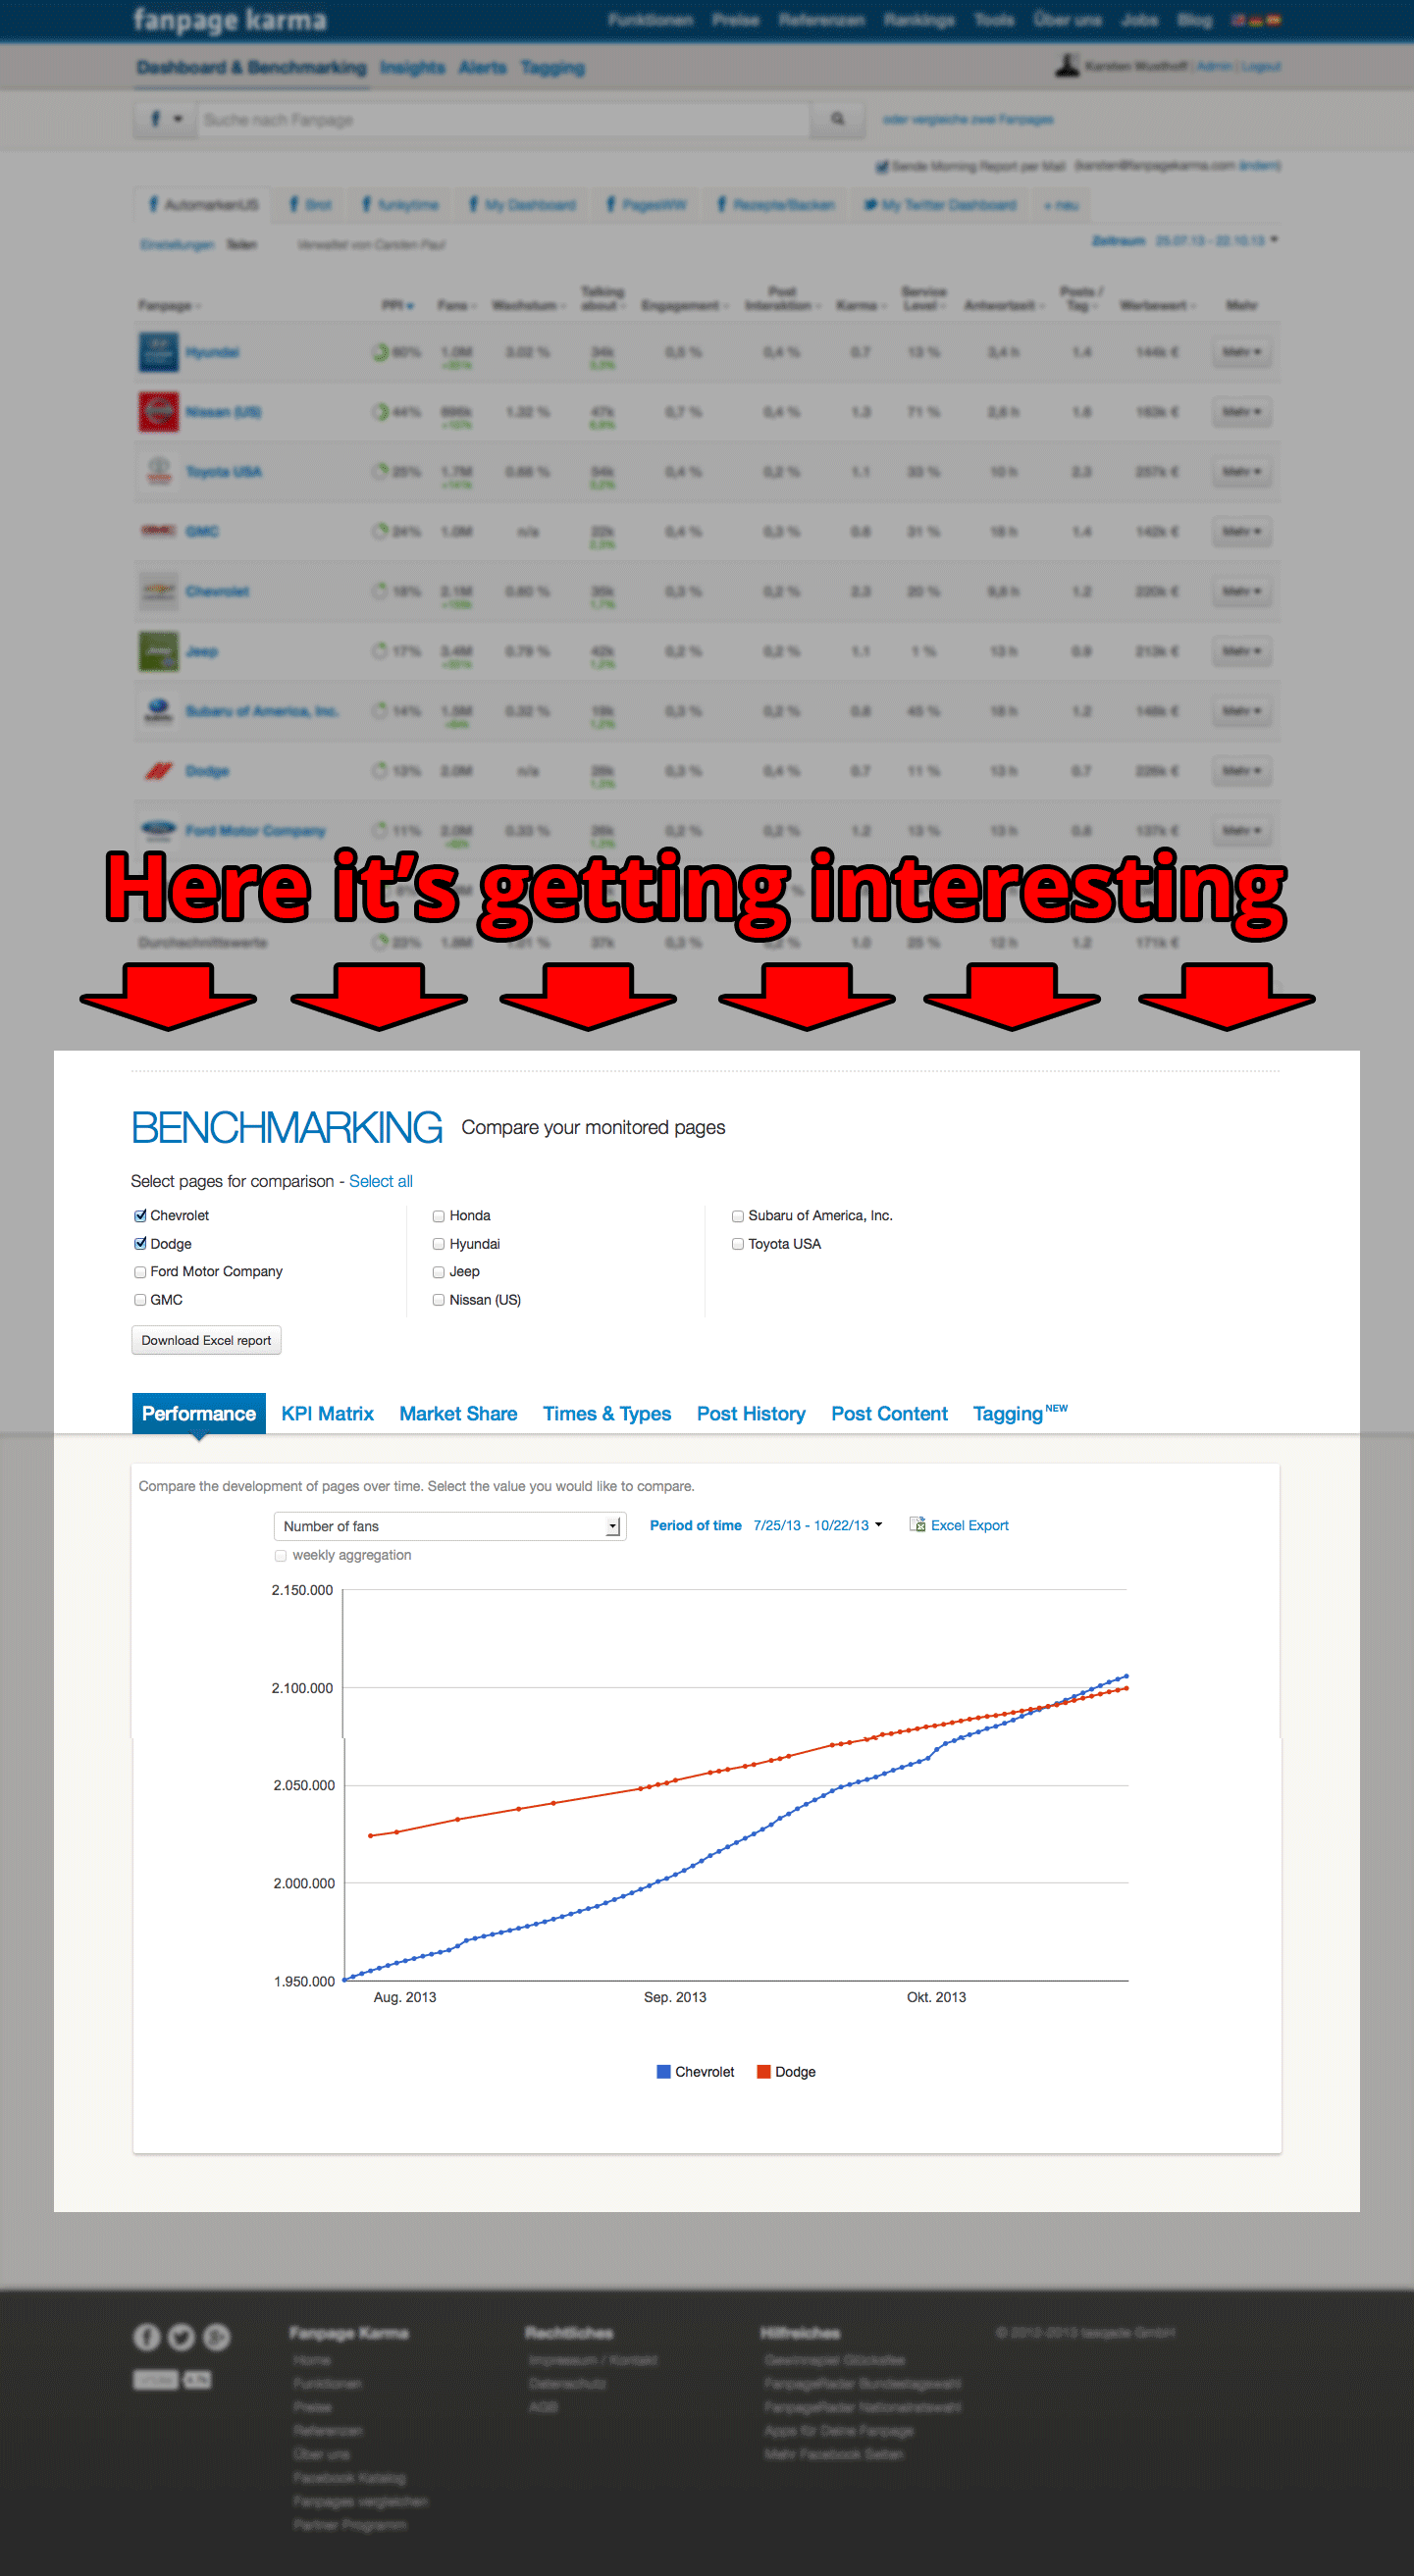
1. Analyze market development

“Performance” lets you see how the pages have performed over time. You can choose the KPIs and the time frame and of course export all the data and the graph into a nice Excel spreadsheet.
Maybe that doesn’t sound too exciting, but there’s a lot of potential here. For example, if you want to check if your social media investments have been yielding results and compare your progress to your competition (Chevrolet’s manager should be pretty satisfied with his company’s growth rate) or if you’re on the lookout for some “role models” (Chevrolet must be doing something right, maybe one can learn a thing or two).
2. Find the right post type
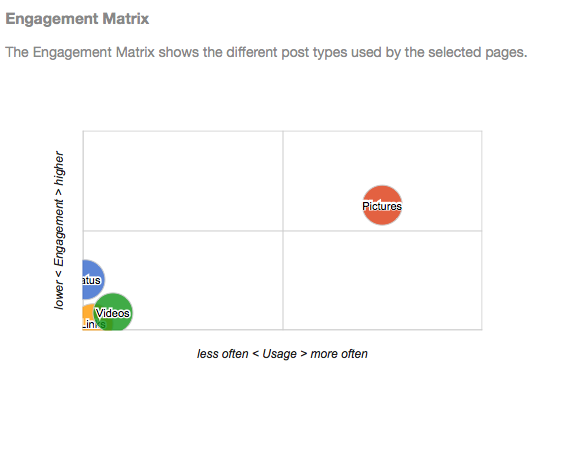
The Engagement Matrix (located in the “Times&Types” section) shows you which post type is used how often and how much engagement it generates.
Maybe you’ll discover that images are very engaging and posted frequently, but videos are just as engaging and barely used. This might be an opportunity for you to improve your content with videos.
3. Discover correlations
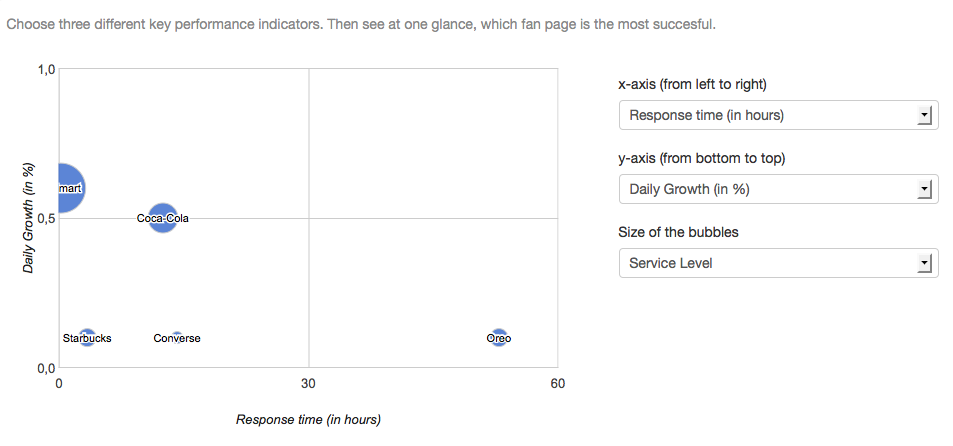
With our KPI Matrix you’re able to compare three KPIs at once. This might sound a little complicated, but it’s super easy to use and even a little exciting. If you fiddle around a little, almost always some interesting possible connections between KPIs come up, that might give you some ideas for your strategy as well.
Above you see that the Facebook Pages with the highest Service-Level and fastest response time have the highest daily growth rate. Just a coincidence?
4. Create a report with one click

If you like archiving stuff or have to create (and maybe even print out) some kind of report regularly, our Benchmarking Report is your new best friend.
Just choose the pages you want to include, click on “Download Excel report”, set some KPIs and we create a beautiful presentation-ready report that you can download immediately. That’s as easy as it gets.
Anything else?
Of course the Fanpage Karma Benchmarking has a lot more features to help you monitor and analyze big amounts of Pages and profiles. We already showed you a couple and will show you some more in the future.
But that shouldn’t keep you from trying it out and analyzing for example your competition. Have fun.