

We already hinted at something great happening here and there. Now it’s time: Our new Instagram Analysis is finished and waiting for you. There is much to discover: extensive benchmarks, successful times & types, history or detailed reporting… Here we present the highlights.
Flexible Dashboard
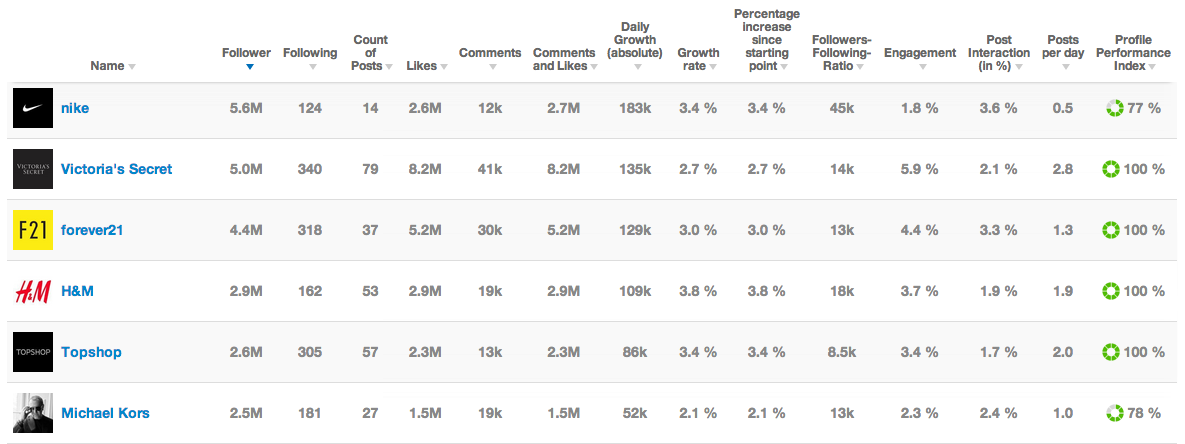
The Dashboard overview shows you at a glance how different Instagram accounts perform. Here, too, you can now manage indicators. Of course we offer Excel-Export with just a click for your Instagram Dashboard, too.
Easy Benchmarking
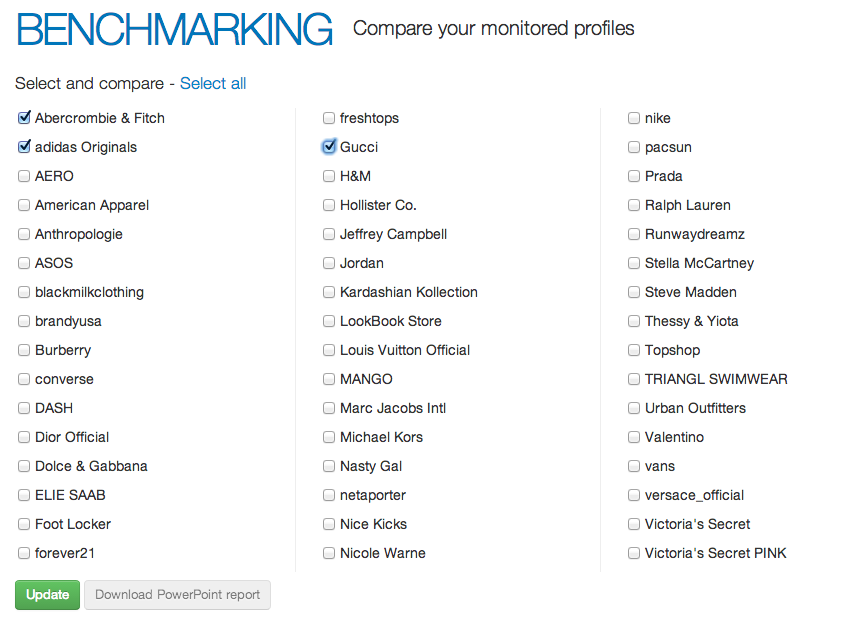
If you want to analyze competitors or a certain industry in detail, you can do that in the Benchmarking area under your Dashboard. It doesn’t only offer a closer look at all selected Instagram profiles, you can also create a presentation-ready PowerPoint export with only a few clicks.
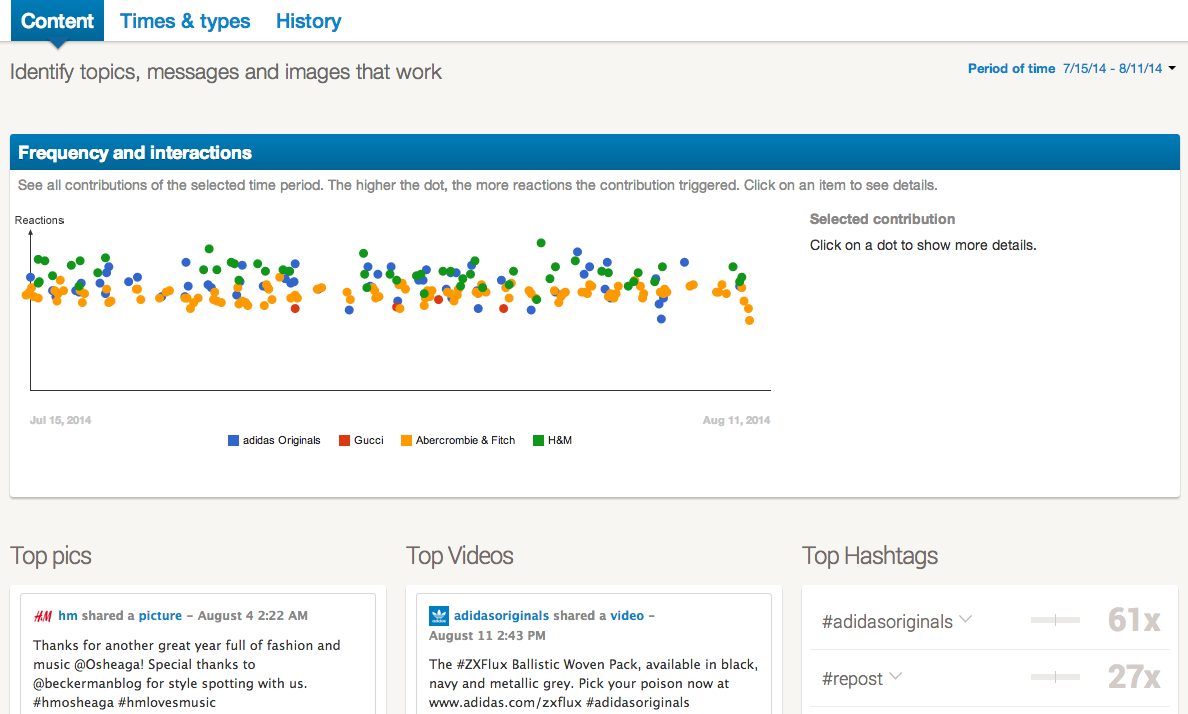
In the Content Tab you can take a look at the best images and videos and you find out, which hashtags and phrases generated most reactions. Of course you can also search all posts for your own search terms.
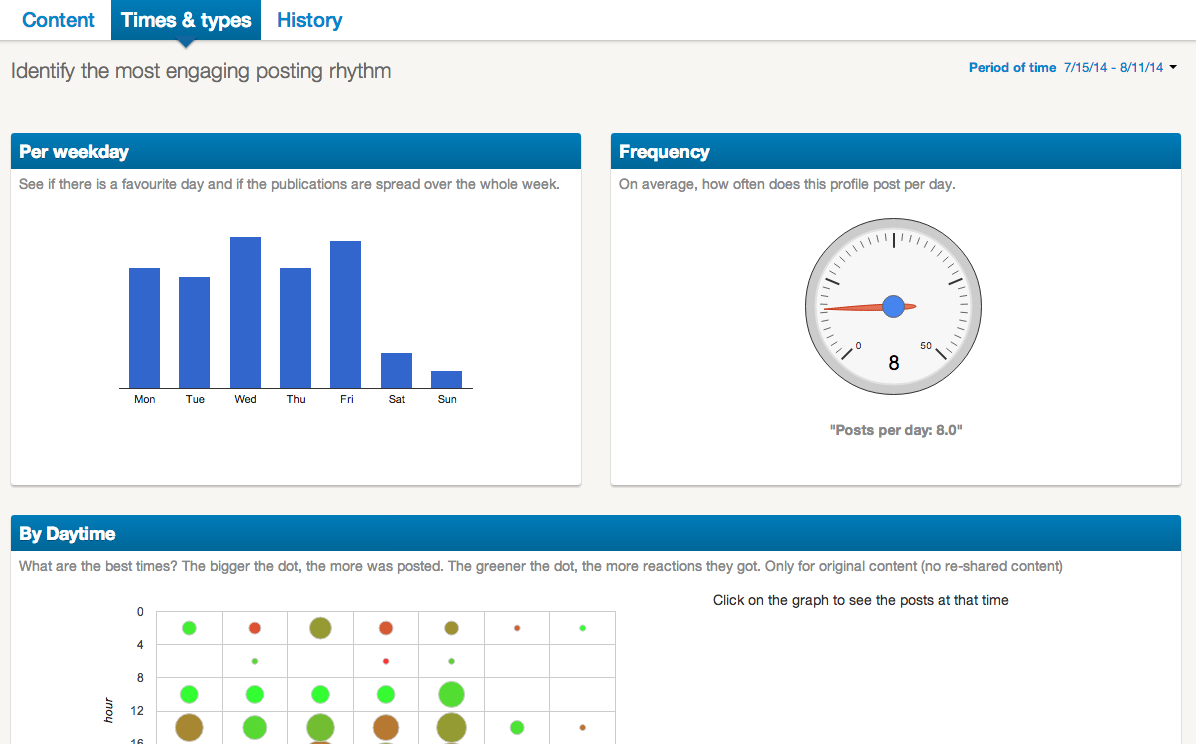
In times & types you learn what was posted when and how often, and which times of day were most successful. Additionally you can find out how many times another Instagram account was mentioned or whether images or videos were posted more often.
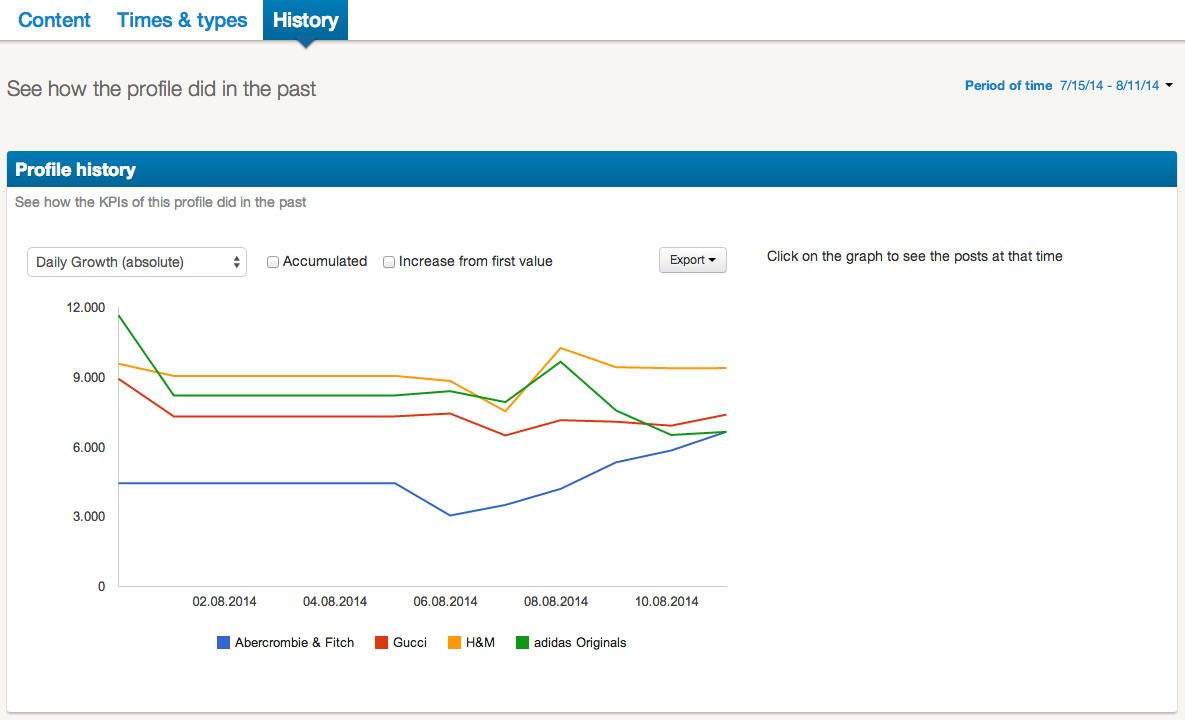
History shows you the progress over time of numerous indicators so you can track the development of a profile – or several profiles in comparison. Of course you can also export the data that’s relevant to you as a Excel-Report, PowerPoint or image file (png).
You can easily analyze your industry, competitors or target groups and easily create extensive and convincing reports.
Detailed Profile-Analysis
In our detailed profile analysis you find the same extensive content analysis in the Content tab. The dot plot additionally shows you, what kind of posts were published: “post”, “with mention”, “with hashtag” or “with mention and hashtag”.
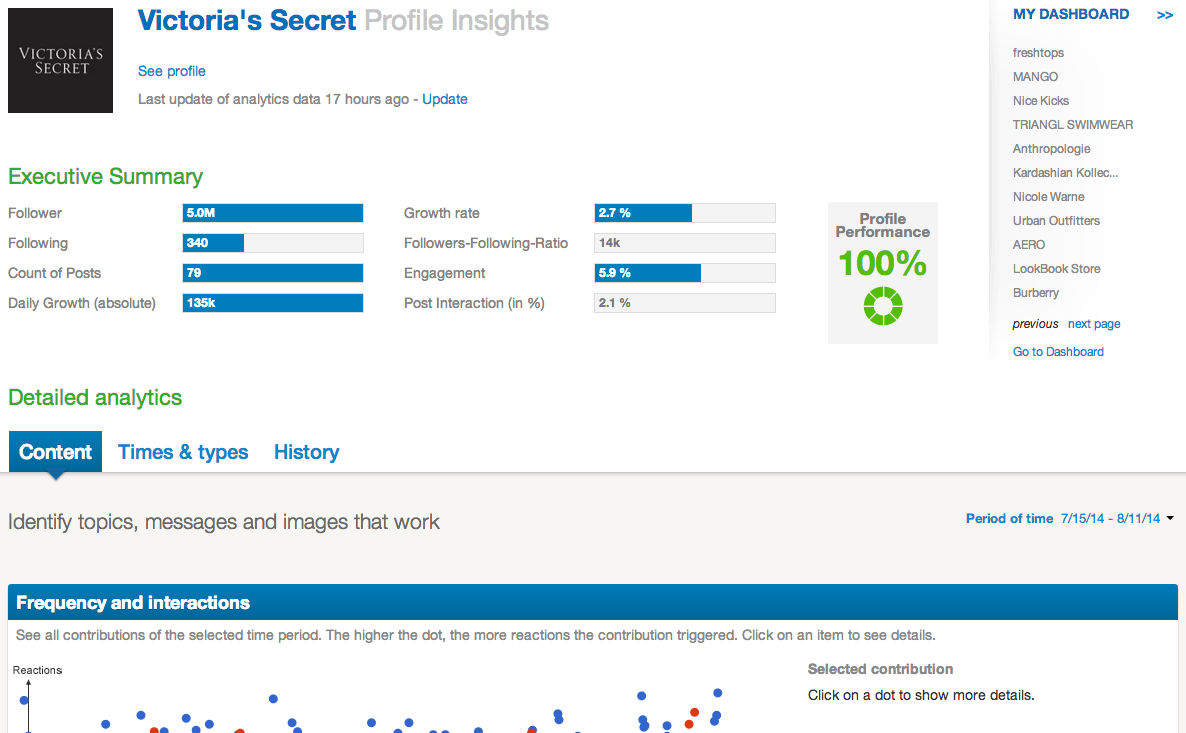
Times & Types displays information about the frequency and kind of posts and the times of day with most interactions.
If you’re interested in the development of a profile, you’ll find the relevant graphs in the History tab, including the convenient exporting feature. Of course you can freely change the time period for Content, Times & Types and History analyses.
Not only can you determine exactly which data you analyze but you can also easily conduct competitor- or industry-analyses with our new Instagram analysis. Detailed content- and progress studies become dead easy.
You want to take your Instagram activities to the next level? Try the extensive analysis for Instagram!