
Just a few weeks ago, we introduced you to our Instagram analysis and yet we have another big update already: Google+. From now on you can’t only analyze, benchmark and export Facebook, Twitter, YouTube and Instagram, but also Google+ pages. Here are some highlights:
Your Dashboard
As usual you can add as many Google+ pages to your dashboards as you like and compare, sort and export the data easily. You can also set your own KPIs and thus create your own individual G+ dashboard.
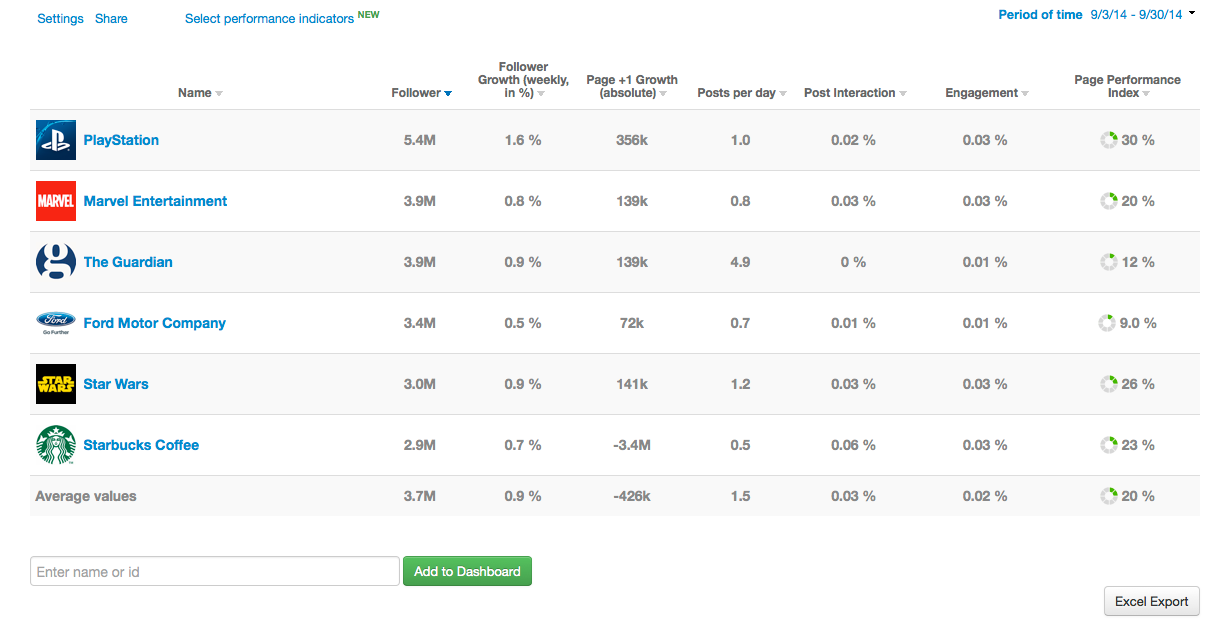
Great Benchmarking
We put a lot of effort into creating an informative and neat benchmarking area for you: Creating and exporting presentation-ready PowerPoint reports, find the most engaging posts and times and comparing the development of different KPIs has never been easier.

When you click on “Content” you’ll first see a graph of all the published posts. If you click on one of the dots, we show you that post and its numbers on the right. If you want to see it on Google+, just click on the date.

Below the graph we show you the best text, picture and link posts and which hashtags and keyword yielded the most reactions. Of course you also can search the posts for your own phrase.
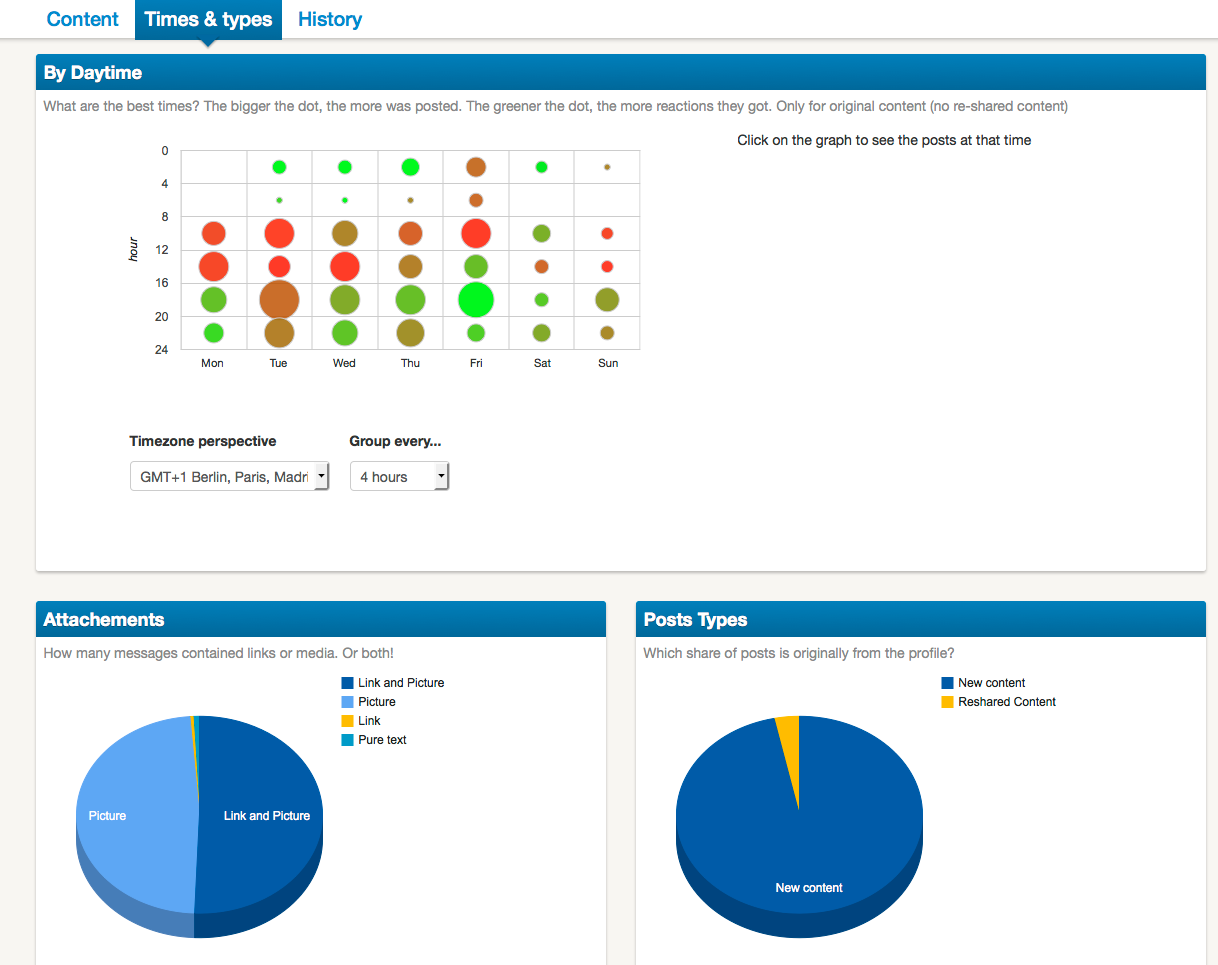
“Times & Types” tells you the average post frequency, which times are popular, what type the posts are (text, picture, link) and how many posts are “new” or shared from other pages.

The “History” lets you compare the development of the chosen pages regarding different KPIs: Which page grows the fastest? Are their suspicious follower spikes? How did the Engagement develop? You’ll find the answer here. Of course it’s possible to set your own time frame and to export the data as an Excel sheet, a PowerPoint presentation oder an image.
Detailed Single Page Analysis
All of the Benchmarking’s analytics tools are also available in the single page analysis. The only (minor) difference: The graph in the “Content” section shows you directly which posts are “new” and which ones are “reposts” from other pages.
But apart from that you’ll find just the same great information about the top content, the best times to publish a post and the development of different KPIs.
With Fanpage Karma you can now easily create industry reports, spy on your competitors and get inspiration for great content on Google+ – the perfect basis for your own successful strategy.
Test it now! You want to take your Google+ activities to the next level? Try the extensive analysis for Google+!