
This week we analyzed one of the most community driven markets known to mankind: The industry of mobile games. Constantly reinventing themselves, video games have become more and more popular over the last decade. They evolved from something only nerds were interested in, to a generally accepted form of entertainment.
But how much support do the titles actually receive? Is the market already on one level with video games that are played in front of a computer or while sitting on the couch? Well, see for yourself.
Fun, fun, fun
Quite a few pages have a large fan base behind them. But Candy Crush Saga schools them all with 71.4m fans, followed by Angry Birds (27.1m), Slotomania (14.4m), Templerun (10.9m), DoubleDown (7.4m), Kiloo Games (7.2m), Pou (6.8m), Fruit Ninja (6.7m) and Hay Day (5.2m)
On average the pages grow by 1.1% weekly, with the best performing pages being Clash of Clans (5.2%), Kiloo Games (2.6%), Big Fish Combo (1.9%) and Hay Day (1.8%). Quite an impressive accomplishment considering the fact that most of these pages already are quite big.
One reason for the size of these pages might be the amount of content they publish. Slotomania (3.9), Big Fish Casino (3.5), Angry Birds (1.6), Megapolis (1.3), Clash of Clans (1.3), Candy Crush Saga (1.2), Puzzle and Dragons (1.2) and Hay Day (1.1) post more often than anyone else.
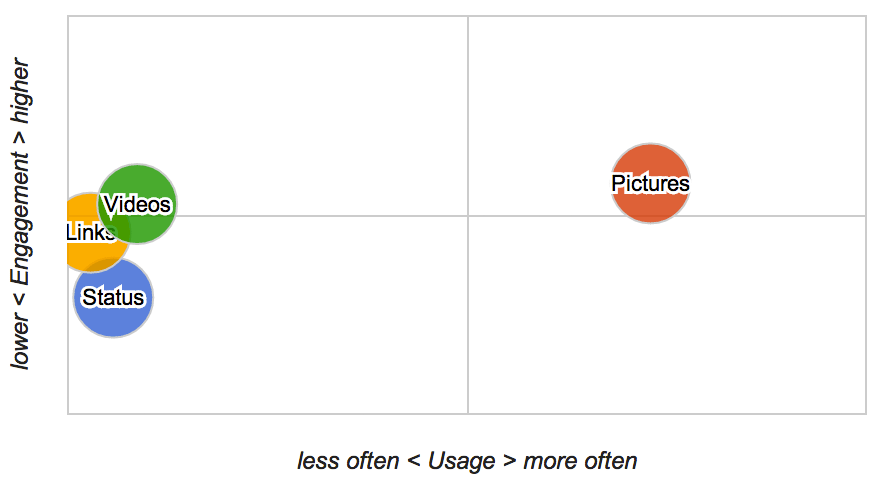
But what do the pages post anyway? Well, looking at the matrix it’s clearly visible that the focus lies on pictures. And due to them also being the most successful medium, that decision is pretty much justified. Videos come in as a close second.
But that surely isn’t all there is to it, right? We went through a few hundred posts to analyze the success of the content. To be in a position to properly judge the posts we created three categories that we deemed appropriate: Fun, Information and Gift.
Fun
Posts that are tagged with the term Fun usually are unrelated to the actual product the page is trying to market. It doesn’t directly advertise something and often is posted to start a conversation with the community. A good example would be a post such as this one

Candy Crush Saga shared a video 8/1/14

 14,317
 1,726
1,726 1,203
1,203
Information
The second group consists of posts that the page uses to spread the word about new features or simply to inform the customers or fans of an upcoming maintenance. However, this doesn’t include lotteries and gifts.
The Hobbit: Kingdoms of Middle-earth shared a picture 8/1/14

45372520
Gift
That’s what the third tag is for. The pages publish so many discount posts that we had to create a separate group for this sort of content. Here’s an example:
Clash of Clans shared a picture 7/31/14

146,30715,17812,718
Now that we have established what the groups stand for, let’s have a look at the result of our analysis.
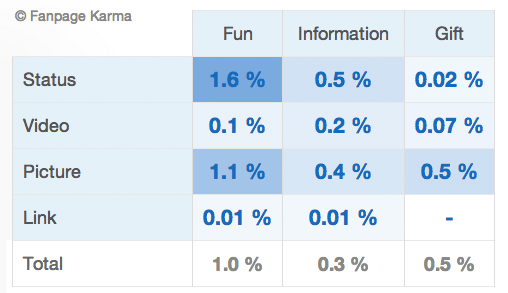
As you can see, Fun generally is the most successful content. Being random, trying to initiate a conversation with your fans or simply posting some hilarious videos will get you more feedback than anything else. But it definitely is interesting to see that this only applies as long as the content is published in the form of a Status or a Picture. As soon as it’s something else the success plummets.
Something similar can be observed when analyzing Gifts. Giving people something isn’t appreciated in any form or shape it seems. Using a picture to spread the word will net you way more success than trying to do so using a Status or Video message.
Informational posts perform worst. Considering the fact that this form of content usually has a negative background (servers being offline e.g.) it’s pretty surprising that it’s pretty successful most of the time. Yes, Links don’t work… at all. But apart from that informational posts perform pretty well. Apparently people prefer to be informed about trouble, rather than being angry about its existence.
The situation on Twitter looks a bit different. Temple Run (629k) has the most followers, followed Angry Birds (628k), Clash of Clans (308k), Pou (136k), CandyCrushSaga (87k), Hay Day (57k), Real Racing (46k), Megapolis (25k) and The Hobbit (20k).
Generally it can be said that Twitter doesn’t seem to be that interesting to mobile game developers. One of the reasons probably is the fact that quite a few are playable on Facebook, meaning: If I can play and ask for help I will probably prefer that to spending my time on a platform that I can’t play the game on. The fact that it’s way more common to share your highscore on Facebook than on Twitter is also important.
But the pages aren’t failing because they don’t try. Angry Birds for example publishes 20 Tweets per day, Clash of Clans 4.6, Puzzle and Dragons 4.6, Ruzzle 2.9, CandyCrushSaga 1.4, The Hobbit 1.4, Hay Day 1.3 and Big Fish Casino 1.2. Plenty of content, but it seems to lack quality.
Another reason for the low success rate could also be the amount of conversations the pages are involved in. Yes, you have a few that initiate many discussions, but the majority falls pretty short on that front. Angry Birds (80%), Puzzle and Dragons (60%), Real Racing (54%), CandyCrushSaga (48%) and Clash of Clans (43%) are the only ones that really try.
Conclusion
All in all it can be observed that most companies focus on Facebook. But that doesn’t really have anything to do with them being too lazy to actively publish content on 2 different platforms. It’s the fans who don’t seem to be interested in browsing a social media page that doesn’t support the games they play.
All calculations were made with Fanpage Karma. Fanpage Karma is an online tool used to analyze social media profiles. Users can monitor an unlimited number of Facebook pages, Twitter profiles or YouTube channels. Either their own or those of competitors. Fanpage Karma provides valuable insights on posting strategies and performance. It gives hints on how to improve engagement.
Would you like to know how you can optimize your social media strategy?
Article Header under CC BY-SA 2.0 license, unchanged, from E-Plus Gruppe Fotostream.
