How different are the posting strategies of american television networks and what do they do to be successful? Is it all on topic? How frequently is cat content used to collect a couple of likes? And how perfectly optimized are strategies and support on the most popular Social Media platforms? We’ll find out.
Some of the biggest pages out there
American TV networks have gigantic fan bases. But to be honest: We didn’t expect MTV (50.4m) to only lead by such a small margin. National Geopgrahic (49.4m) is incredibly close to reaching the 50m fans themselves. Similar networks follow: Discovery with 28.3m fans, Cartoon Network (27.9m), Nickelodeon (25.9m), History (20.1m), Animal Planet (16.4m) and CNN (14.5m). What we instantly noticed is that most of them are networks that provide content no one else does. They aren’t specialized in news everybody has access to, or sports broadcasting that you can easily find streams for, but life and nature documentaries, as well as comedy and cartoons. Something that is harder to find because you can’t just google ‘my type of humor’. The fastest growing ones? TBS Very Funny (7.4%), MAVTV, Pursuit Channel (2.5%), FXX (2.4%), El Rey Network (2.2%), Deystar Television and Destination America (2.1%)
The most content is published by RT (32), VH1 (26), CNN (24), Pursuit Channel (22), ABC News (22), MTV (21), Fox Sports 1 (18) and HLN (16). Most of it is cat content. Quite literally.
When it comes to supporting their community there are only a few that do so properly. Liquidation Channel (90%/0.8h) is one of them. Also part of the group are BabyTV (89%/20h) with 5.5 user posts per day on average, BabyFirstTV (89%/17h) with 4.6, Jewelry Television (86%/12h) with 3.8 and ShopHQ (79%/11h) replying to 6.8 posts on a daily basis.
Low amount of conversations
CNN (13.6m) has the most followers on Twitter, followed by MTV (11.1m), ESPN (10.5m), E! Online (6.5m), Fox News (4.1m), Nickelodeon (3.5m), ABC News (3.4m), Discovery (2.6m) and CNN International (2.4m). Which is pretty surprising, considering how far behind some of them are on Facebook. Twitter once again proves itself to be the favorable platform for companies that focus on getting messages out quickly, something National Geographics or Cartoon Network simply don’t have a reason for.
How successful are they? While analyzing the networks we found a few pretty interesting things about them and their posting habits. Generally we can say that lifestyle stations will almost always try harder to establish a conversation with their followers. But don’t mistake the Twitter accounts as pure customer support channels, because none of them really are. HSN has the most conversations of any network. 71% of their tweets involve talking to other users. Disney Junior (66%), QVC (55%), MTV (50%), TBS (41%), Nickelodeon (38%) and GSN (37%) follow.
So the conversation rate is pretty low, which automatically means that they will ship a lot of content. MTV publishes most. 124 Tweets a day is nothing short of impressive, especially considering the small amount of conversations. Zee TV (63), OprahWinfrey (60), ABC7 (59), RT (56), Hallmark Channel (54), ABC News (52), CNN (48), E! Online (46) are trying their best to keep up. But how does that work out for them? Well, let’s say that it depends.
What difference a branch can make
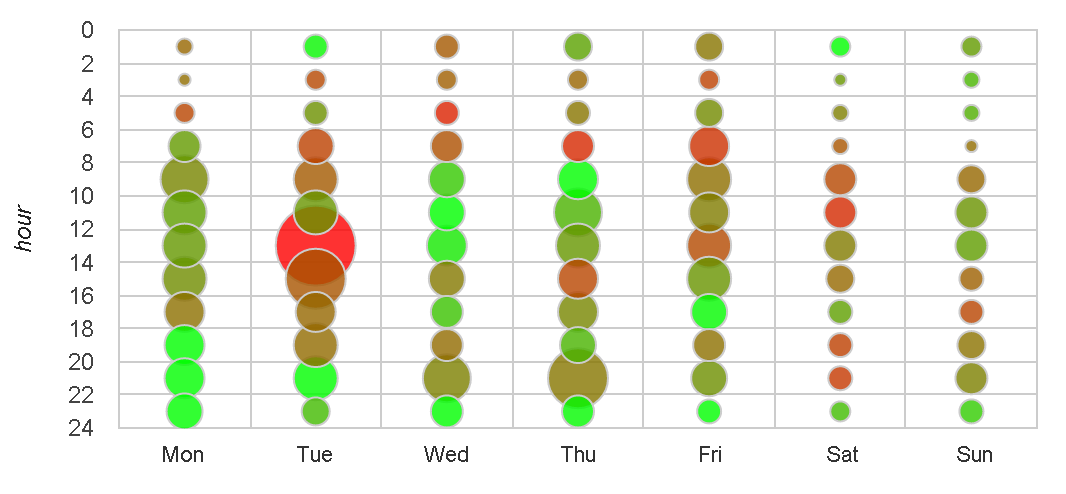
We did build a few groups, each one made up of multiple television networks to see whether or not there is a difference in success depending on what sort of type you specialize in. First we grouped up all the news networks. The focus is on general news, meaning the network focuses on covering every topic, from finance to politics (examples: CNN, FoxNews or ABC News).
As you can see: News networks are especially successful at the later hours of the day but generally manage to reach their followers at almost every time of the day. They should definitely adjust their posting behavior between 12-8pm on a tuesday though because the content ends up being overlooked quite a bit.
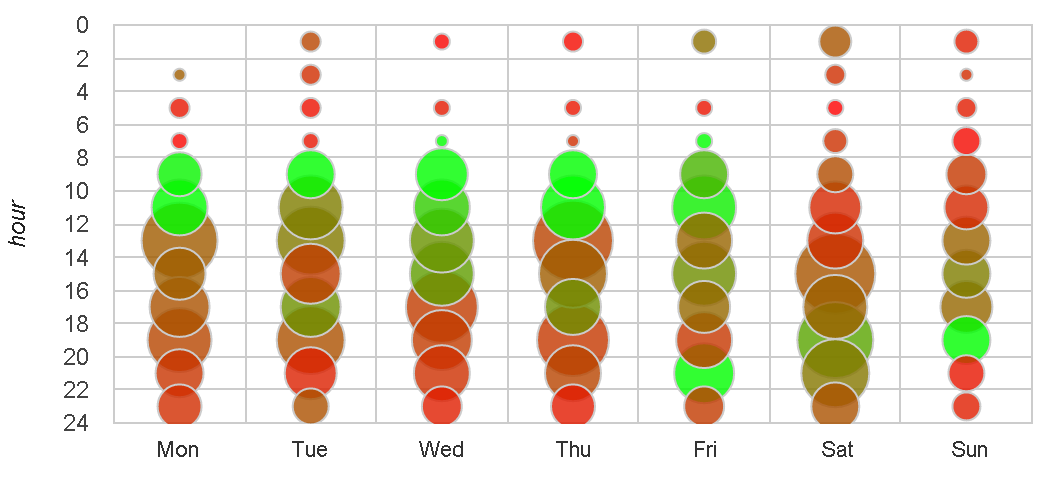
The second group consists of sports networks. This group exclusively reports about sport events. Be that the NFL, NBA, MLS or all of it. As long as the focus of the network is on sports, and not general news, it qualifies (examples: ESPN, Fox Soccer Plus or NFL Redzone).
Pure sports networks have a harder time. Their posts generally flop, unless they published them in the earlier hours on a weekday or in the evening on the weekend. Which probably also has something to do with the fact that there are less events on weekdays, but that doesn’t explain why content published in the early hours is so successful. It’s interesting to see that the interest seems to plummet quite fast though.
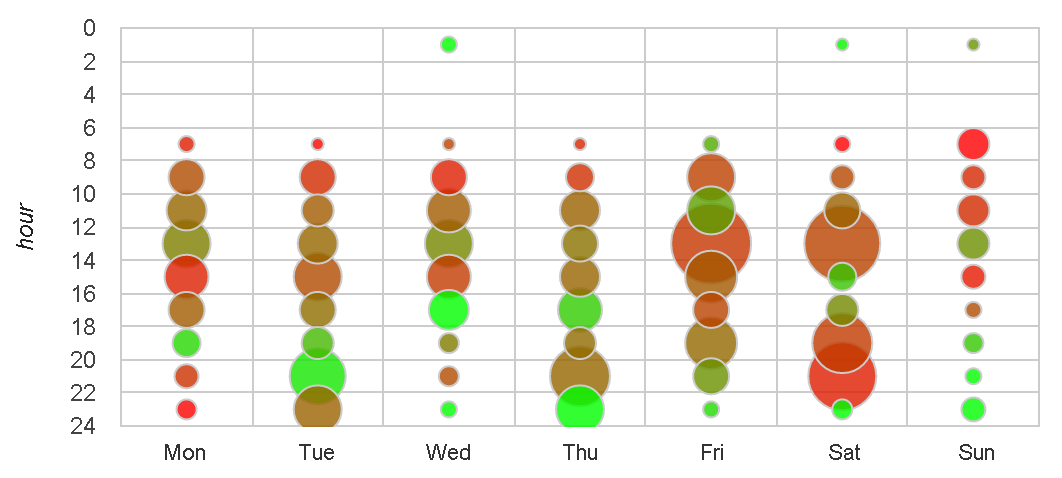
The last group are cartoon networks, whose main audience usually are kids. These stations have their focus on appealing to the younger generation. (examples: Nick Jr, Disney Channel or Cartoon Network).
One of the least consistent groups. What is interesting to see though is the fact that these networks aren’t only watched by kids. Unless they are allowed to stay up until after 10pm on a weekday, which is highly questionable. The focus should definitely be changed tough. Content posted on saturday is pretty wasted and the networks should try to make more use of the good performance on sunday evenings.
We picked these three groups because they have the most distinct differences in terms of success. Of course we could analyze all sorts of networks here. Be that travel, cooking or home shopping stations. But at the end of the day you will have to look into the data of your page by yourself. Only then will you be able to significantly improve your performance. These examples are industry averages. So even if your network is part of the analysis, that doesn’t mean that the results are completely matching your accomplishment. Maybe your page is the exception? You never know.

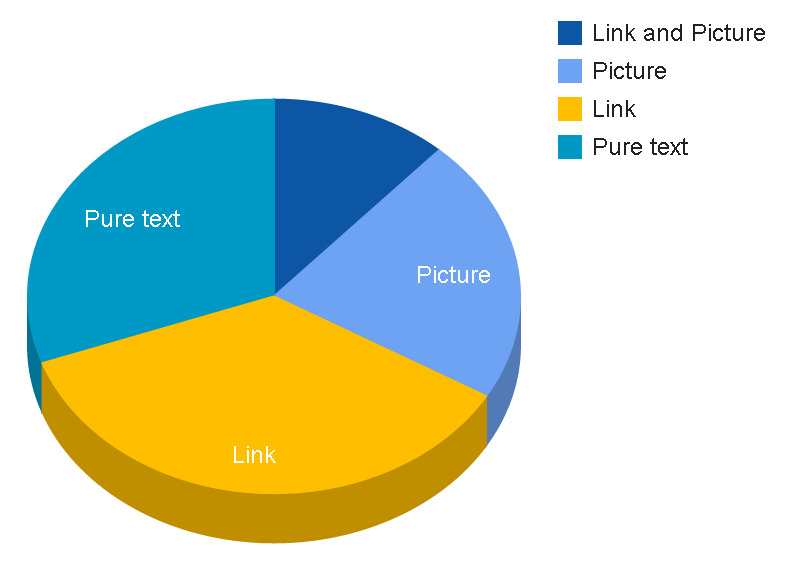
Something that is pretty interesting as well is the almost non-existent difference between content types. No matter what industry, they all focus on publishing Links, with a few pure status updates and pictures in between. That’s actually surprising because we expected sports networks, for example, to publish a lot more pictures due to it being rather easy to find fitting ones.
Conclusion
The difference that the posting time can make is stunning. So to optimize your success you should first adjust that. Afterwards you can focus on publish different, more appealing content. Maybe the content isn’t even the problem at the moment but people simply not seeing it is? An individual analysis will definitely help you with collecting necessary insights.
We were surprised about the success of cat content though. Some pages even have more reach as soon as they decide to post off topic. Something that might be an option for you as well?
All calculations were made with Fanpage Karma. Fanpage Karma is an online tool used to analyze social media profiles. Users can monitor an unlimited number of Facebook pages, Twitter profiles or YouTube channels. Either their own or those of competitors. Fanpage Karma provides valuable insights on posting strategies and performance. It gives hints on how to improve engagement.
Would you like to know how you can optimize your social media strategy?
Article Header under CC BY-SA 2.0 license, unchanged, from Esther Vargas.


