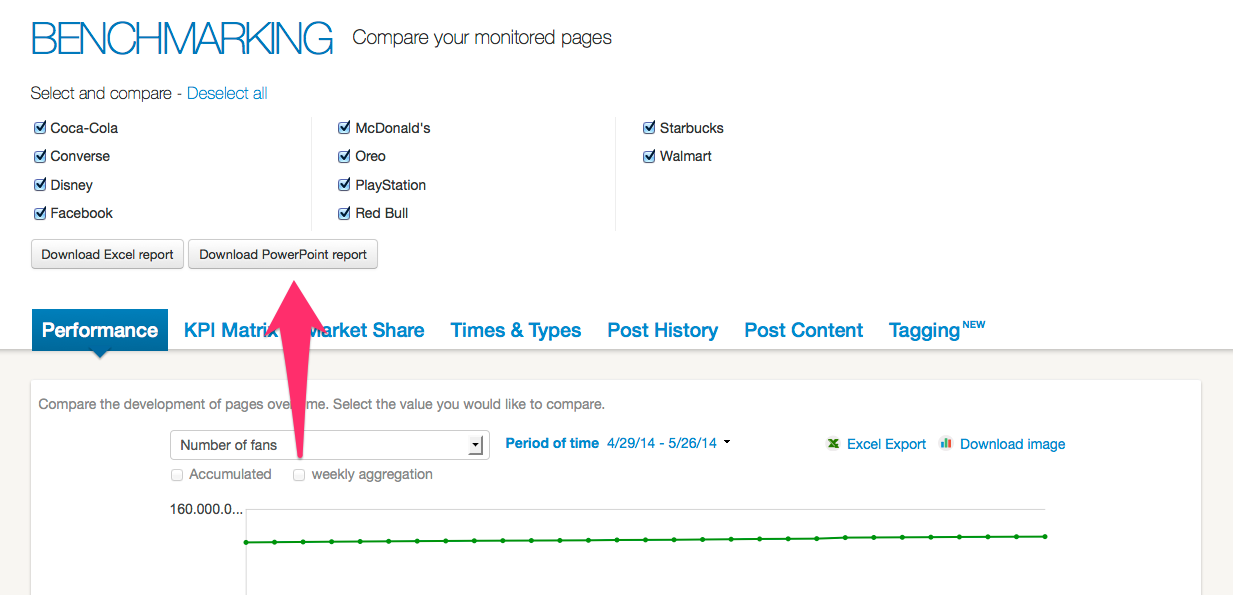
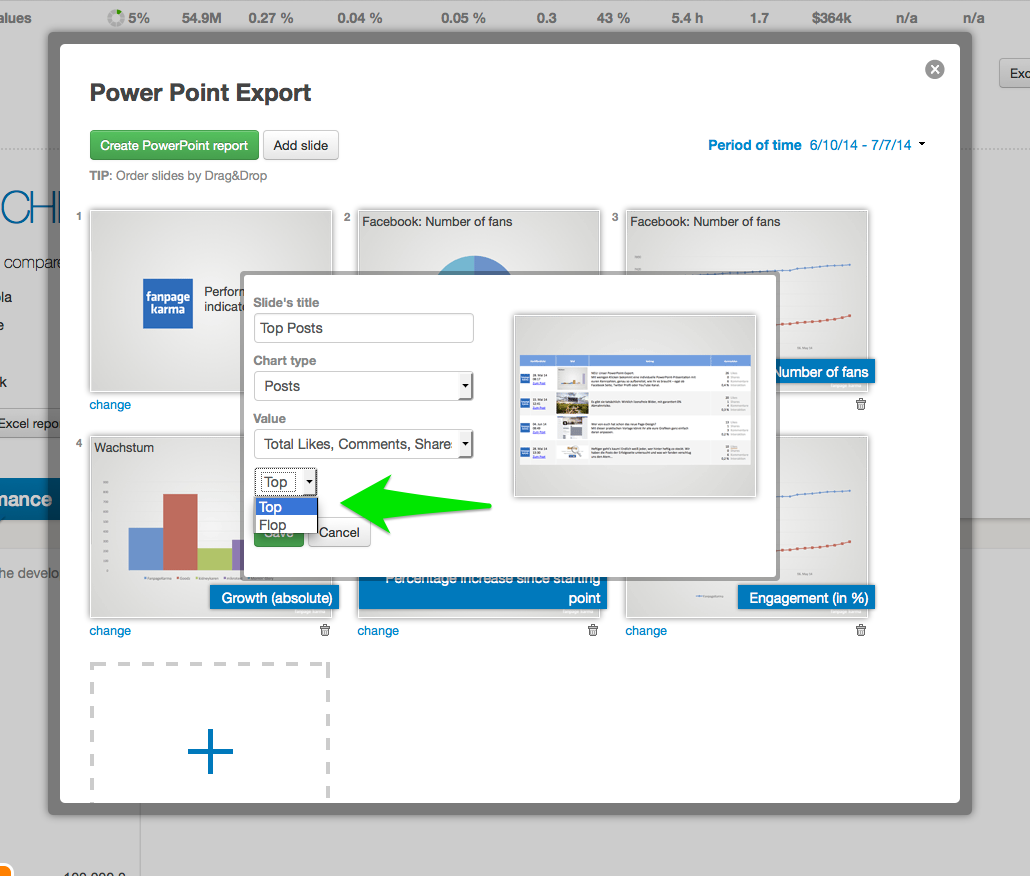
Our next big update is just around the corner, but before we get to unveil what we worked on for the last couple of weeks, we’d like to show you our newest great little feature: Exporting posts to your PowerPoint report.
That way you can easily add a list of top or flop posts directly to your PowerPoint presentation and thus increase the quality of your reporting a lot. Oh, and it saves a lot of time.
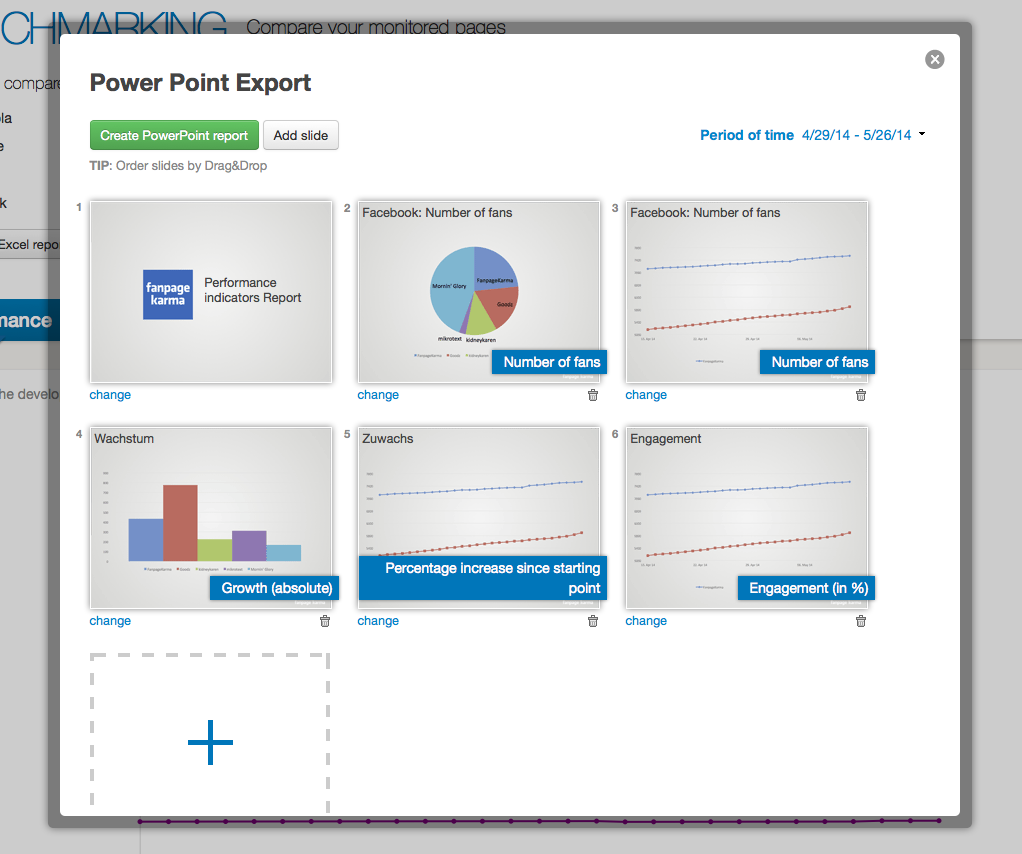
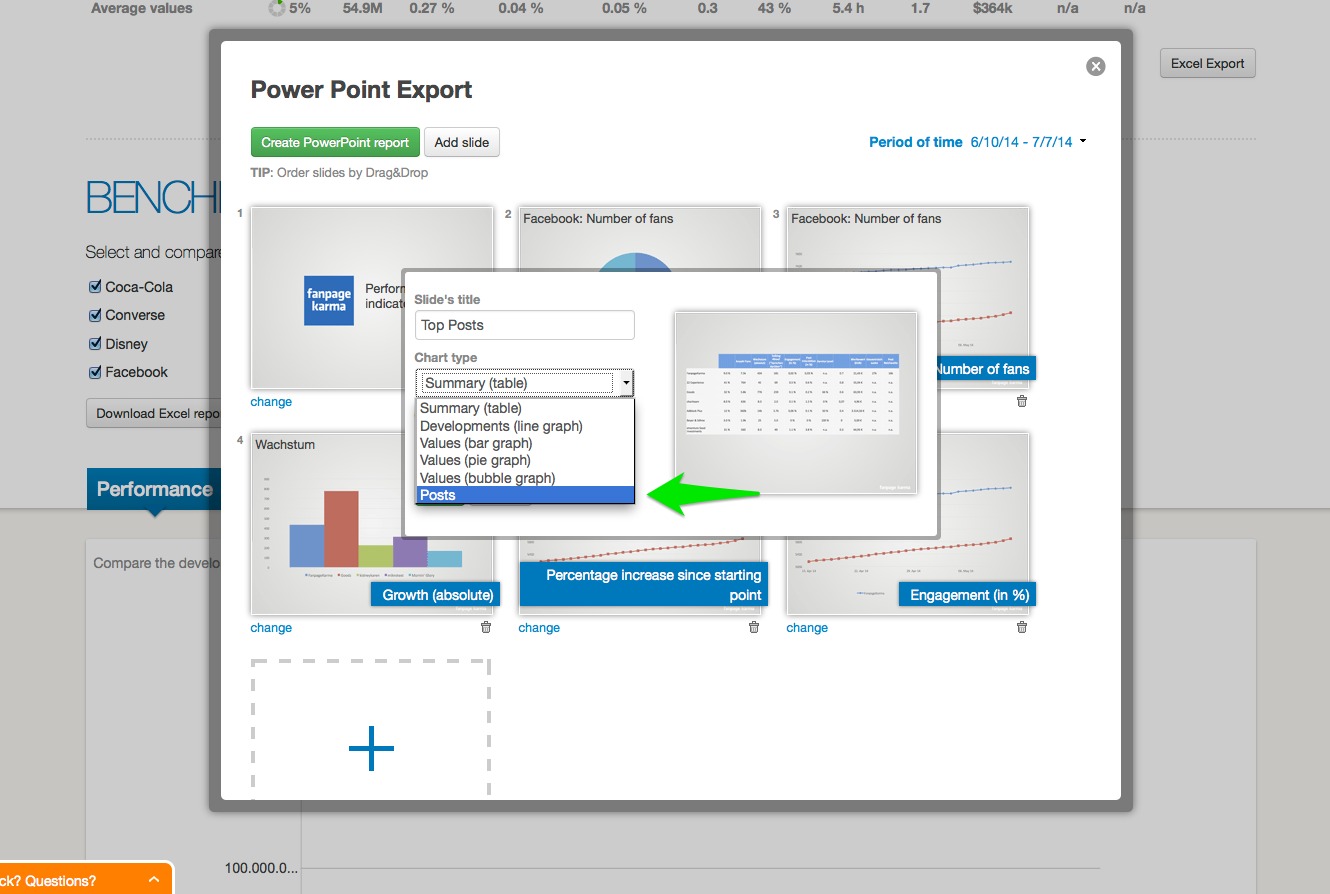
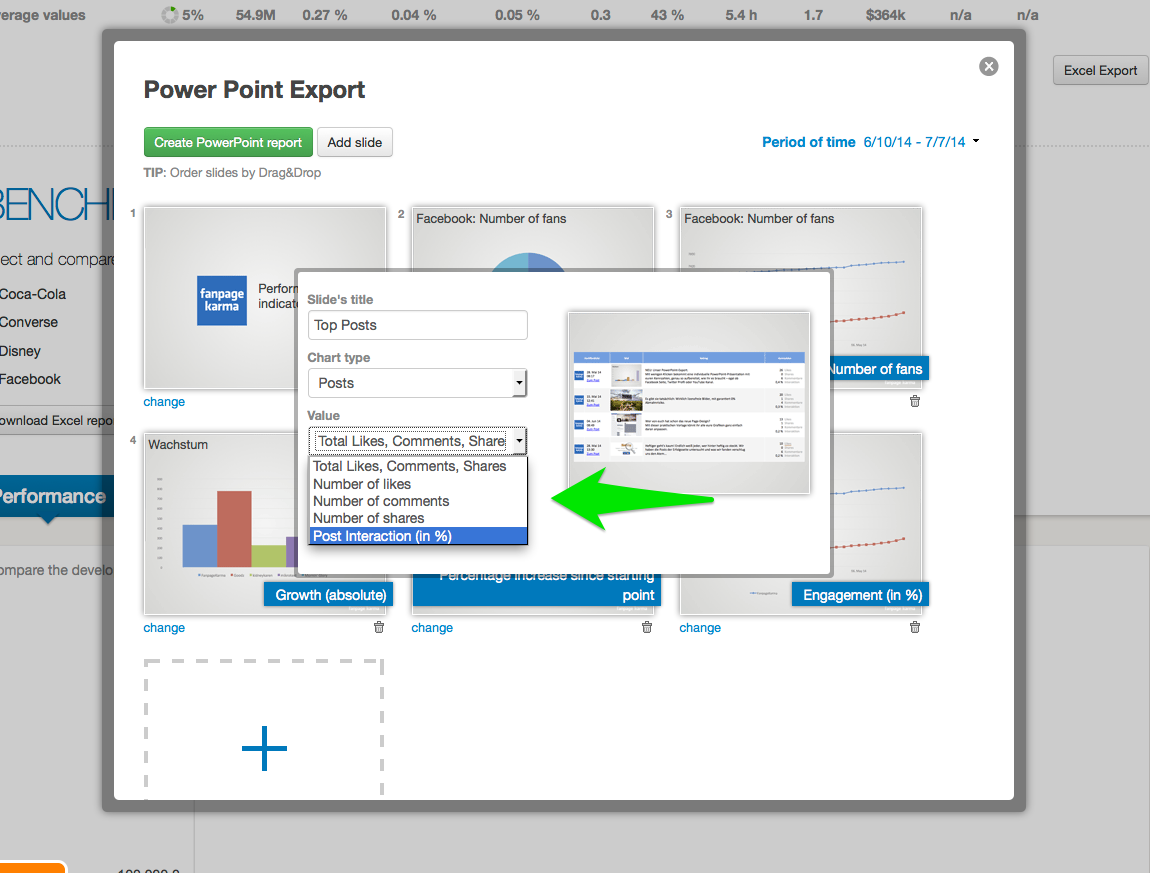
Doing this is easy as pie: Just add or edit a slide, choose “posts” as chart type, set your KPIs and select if you want to see the top or flop posts. This works of course for any page and not just your own.
Which ones are your top posts? Find out now – it’s 100% free
Featured image: János Balázs – CC-BY-SA


