Everybody that handles a fanpage has asked themselves the same question: How can I share my posts so they get the highest attention – not only in the sense of visibility, but also in relation to reactions, comments, engagement.
So it’s about time to introduce the Fanpage Karma features to you that can help you with timing your posts the right way. For this we chose three different approaches: the egocentric look at yourself, the comprehensive analyses of your competitors and the bigger picture approach that includes other platforms. We picked a couple of well-loved German magazines for this feature presentation, that might interest you. Obviously the different approaches we present to you here do not apply to the publishing sector only.
“Me, me, me” – the egocentric approach.
The common egocentric generally looks at himself. Additionally – of course – his influence on his direct surroundings. In plain terms: At which times did my posts perform especially well? With Fanpage Karma you can access this data for all your connected Social Media Accounts and determine individually, which time works best. You can find this information in the menu under “Insights”. The tab “Times and Types” organizes all relevant features neatly.
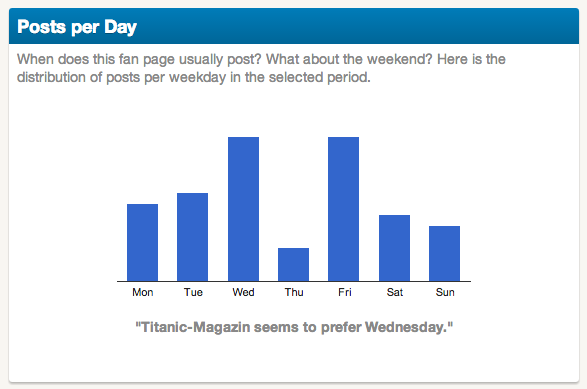
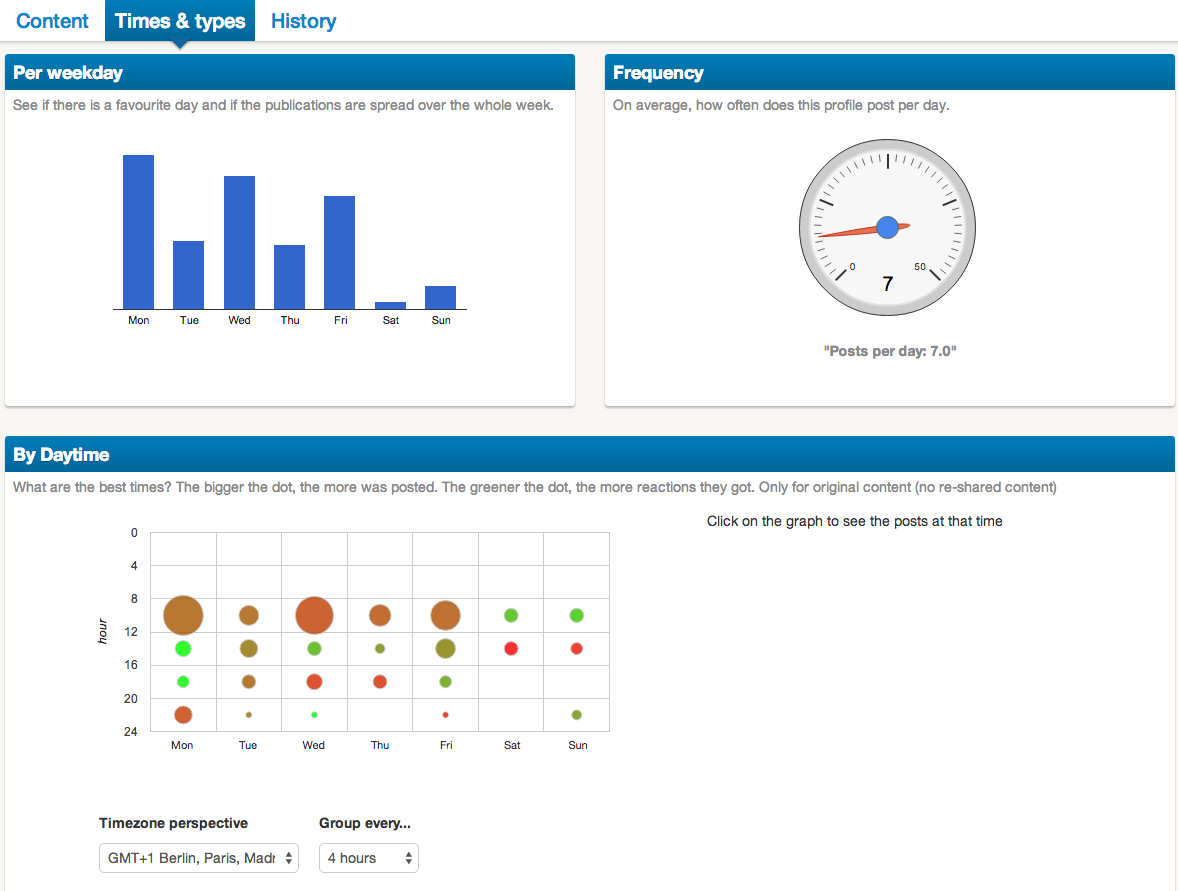
The breakdown of Posts per Day shows you at one glance when most posts are shared. In any given period of time. Incidentally, Fanpage Karma tells you whether a different day wouldn’t be better for posting. On mouse-over you get additional information, like how many posts were shared on that day in the given period of time.
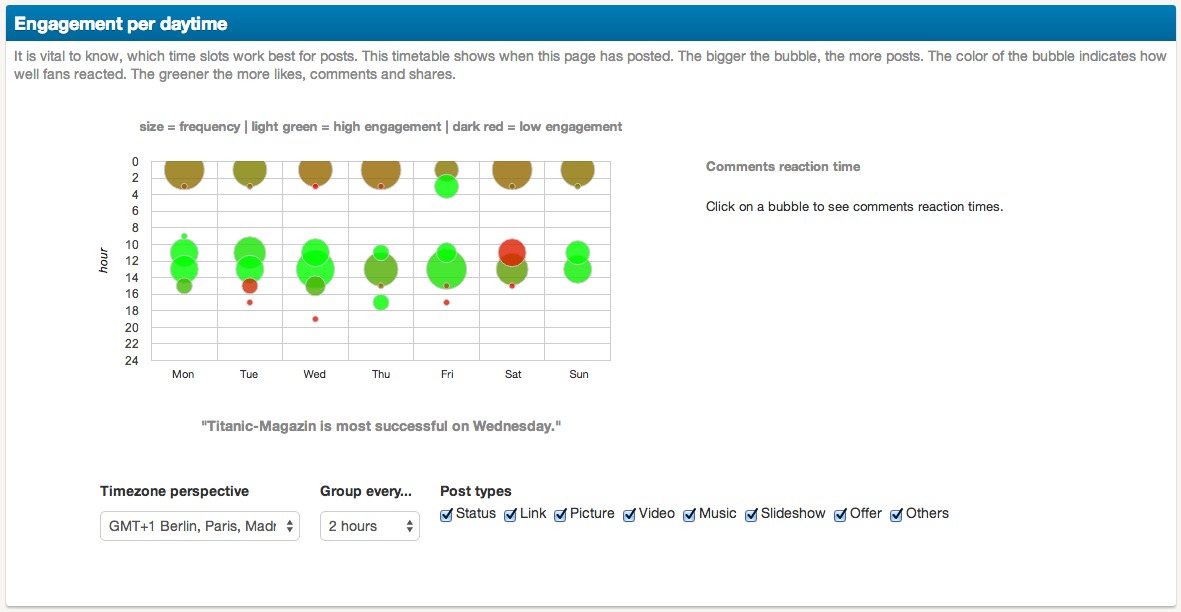
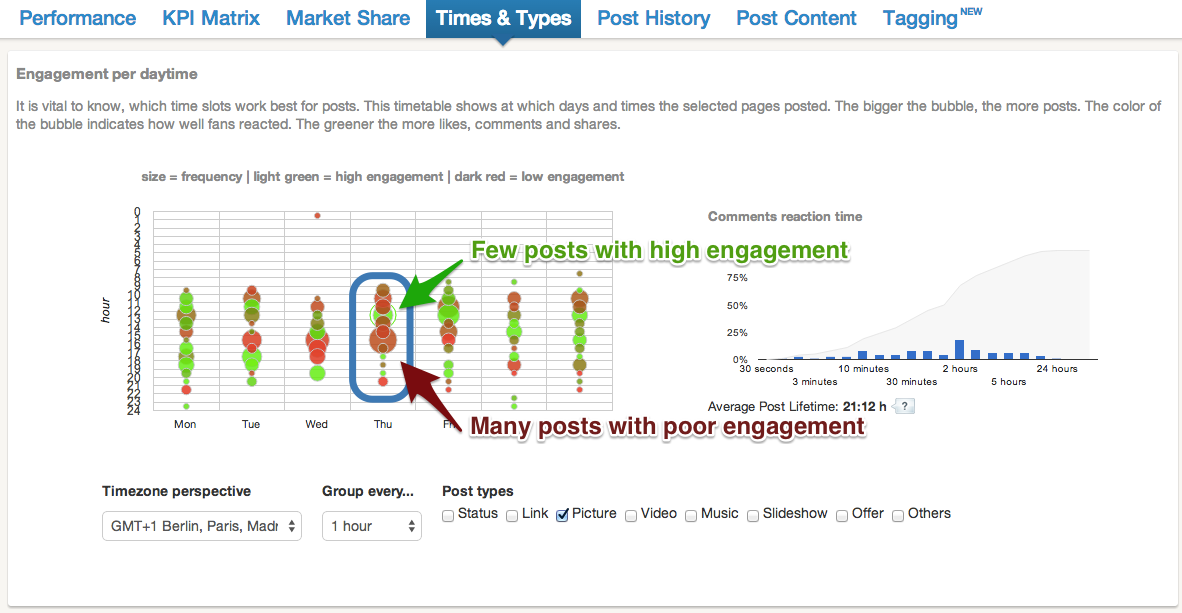
The most exciting part about optimizing posting times is the detailed analyses of the “Engagement per Daytime”. Here you can see -in detail – how many reactions your posts have generated at any given time of day – or haven’t. Additionally you can analyze the Average Post Lifetime, which post types perform best at what time, how long it took until most comments were made – but this need to be done one step at a time. Let’s start at the beginning:
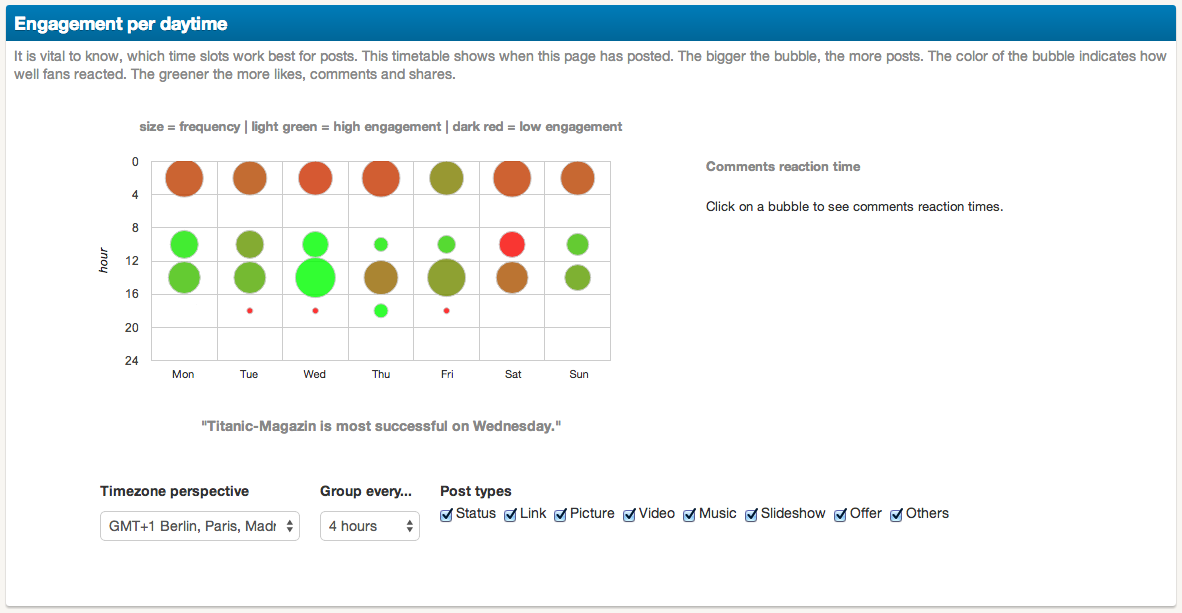
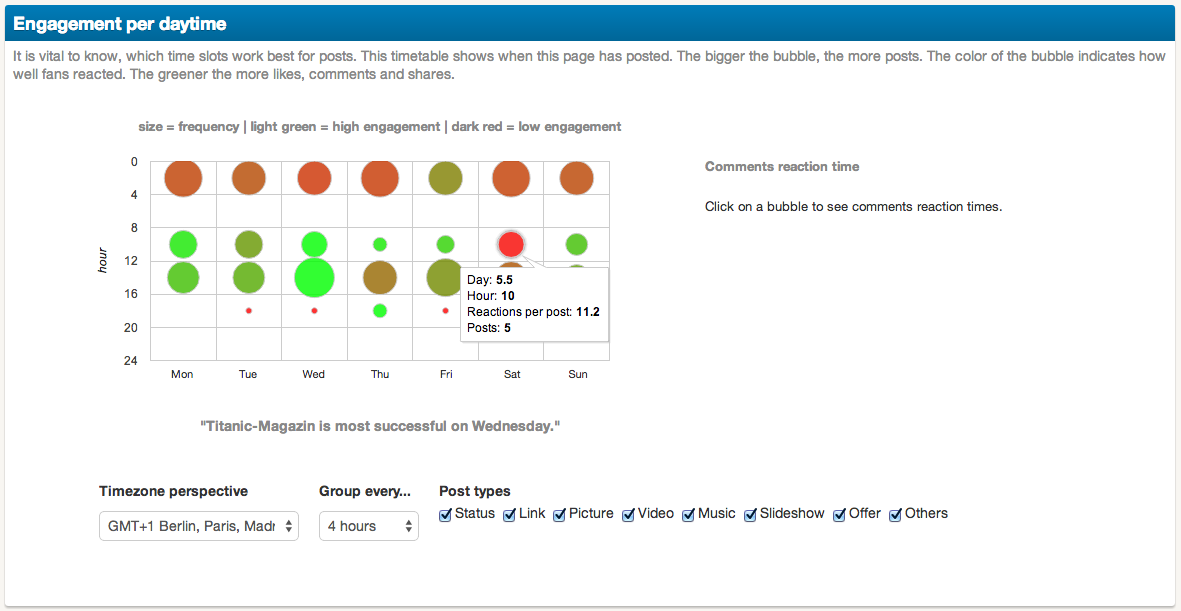
In the overview of Engagement per Daytime you have a visual distinction for how often (or rarely) posts were shared and which posts performed well (or badly) at what time. In the depiction that translates into bigger circles meaning, that there are more posts at these times of day. The second dimension that you can see is the number of reactions. That is conveyed by color: the lighter and brighter the green, the more reactions per post. If you hover over one of the circles now, you get additional information: What time is shown, exactly, reactions per post and amount of posts that were shared at this time of day.
Additionally, you can set your timezone and which interval should be used for the day. You can pick between 1h to 6h intervals. If you change the interval, the visualization will be more detailed:
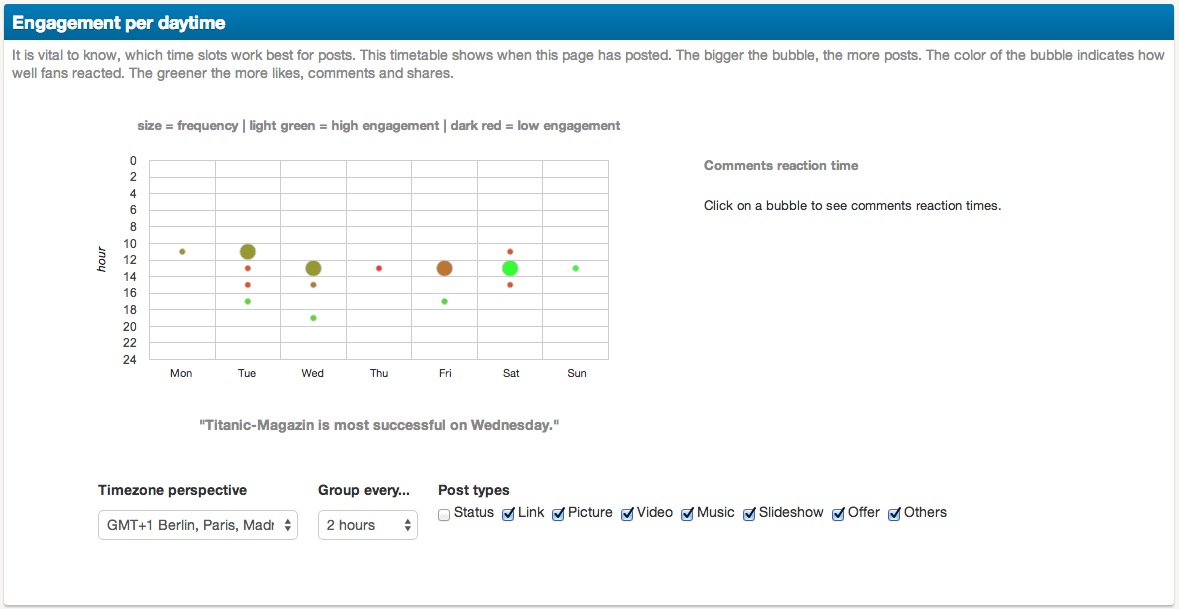
You can already see patterns and draw conclusions with all this information. In this case, that wednesday is the best performing day. For a quick info about a suitable posting time, a glance at this graph is enough to know when you should and can post. But professionals now probably ask: There has to be a difference between post types – images, links, status updates, it can’t all perform the same way! You’re right. With the post types feature you can differentiate between types of posts that are displayed:
Detailed analyses to one’s heart’s content – what else could you want? More. More data. You get that. The attentive reader probably noticed the text next to the graph: “comments reaction time”. We’ll explain what is hidden behind this feature now. Click on a circle in the graph to pull up the detailed view:
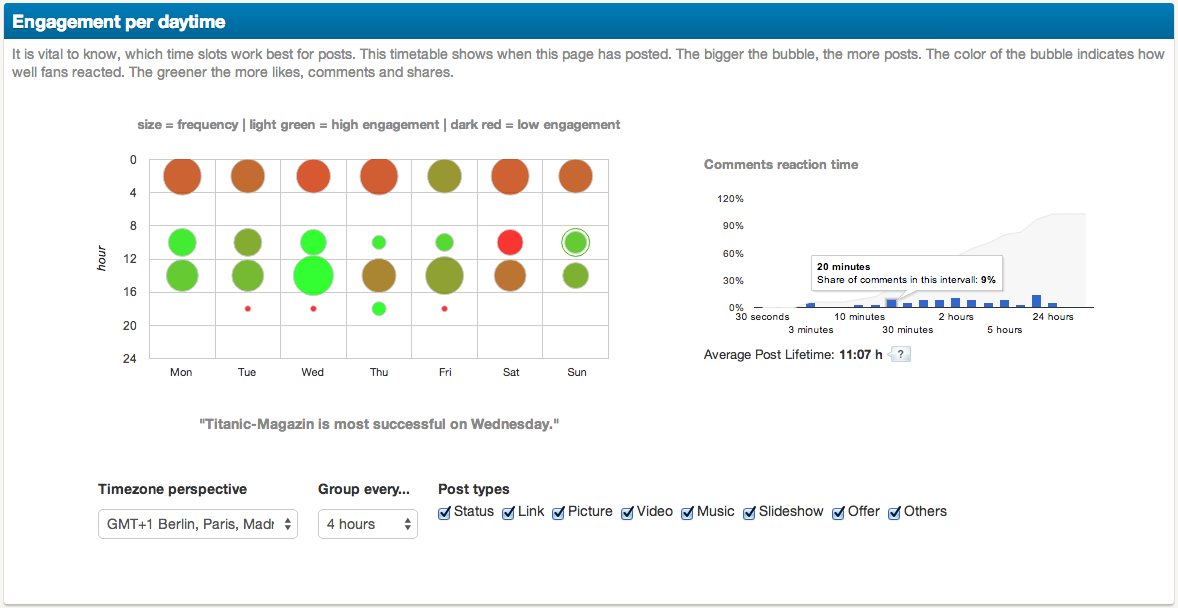
Now you can see how long it took for the shown group of posts to reach 80% of its lifetime comments, and how many comments were made in total. Additionally you can see the intervals in which comments were made. Before you ask: comments are the only dimension of reactions (likes, shares, comments) that are delivered with timestamps. A chronological analyses is subsequently only possible by comments. Congratulations. You successfully passed the crash course “egocentric optimizing of posting times”.
“What are you doing there?” – the comprehensive approach.
You probably already figured that this isn’t all. Only looking at yourself can be nice and informative, but usually isn’t the best strategy. To be better, you have to compete with others. You guessed it: There is a benchmark in your future.
Courtesy of the Fanpage Karma Dashboard, you can compare unlimited fanpages. Suddenly there isn’t the one time that you post, now you can look at reactions, engagement, reaction time and average post lifetime in comparison.
This means you need to use the benchmarking feature of your dashboard: When you are at the dashboard view and scroll down, you can see the benchmarking section. Here you can define which competitors you want to analyze, over which time frame, and whether you’d like that as a PowerPoint- and Excel Report or as an interactive graph in your web interface. Now click on Times & Types and you will end up in the detailed analyses of posts again – but this time of all posts.
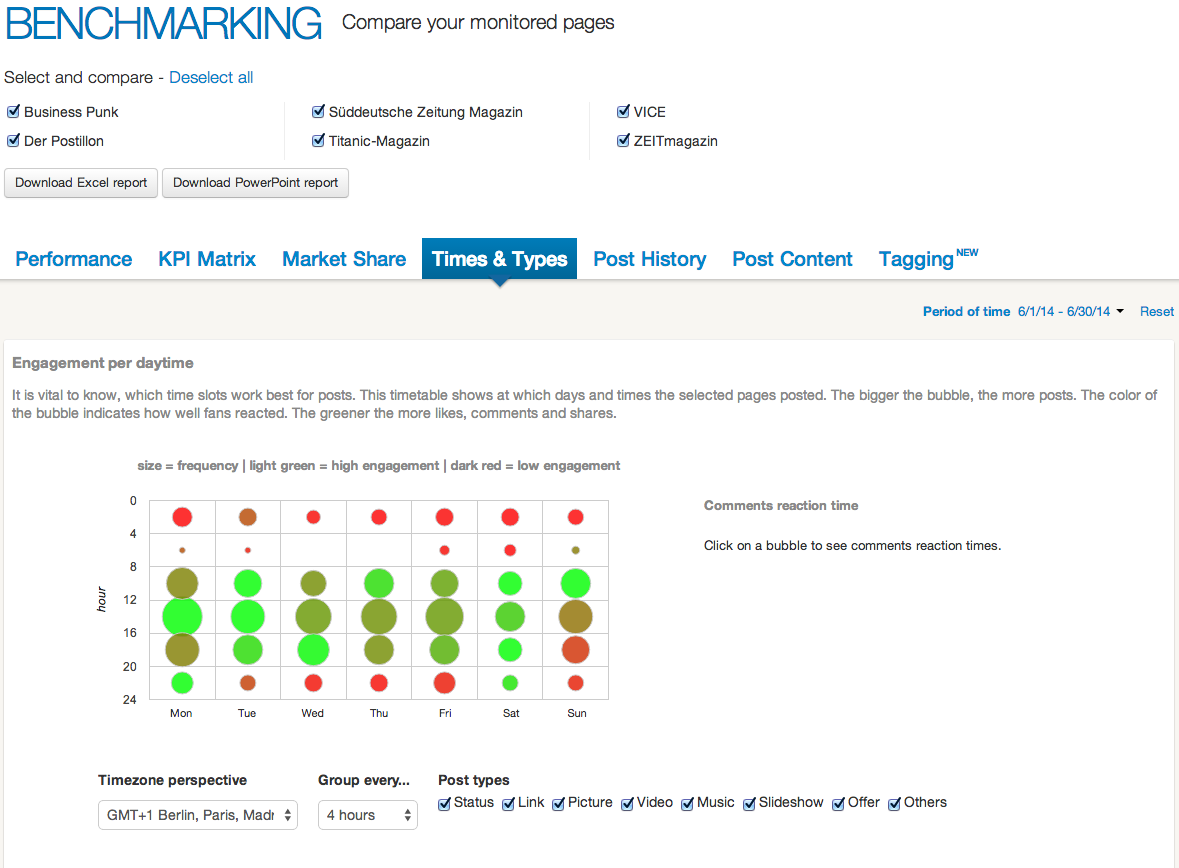
The features explained above are now extended to include posts of your competitors. In case you’re asking yourself what you get out of that, do not fret, an application example follows:
Why are your competitors posts important? Because they have a similar, overlapping target group they’re communicating with. The target group however, does not care who came first – it’s important who ends up in the NewsFeed. What follows is a small scavenger hunt for “standard timings” of the competition to find your own little niche. 30 min can make a big difference, so here we go:
First you need to decide wether you want to look at all posts or single post types. We recommend to analyze a time frame that is as long as possible and to look at each single post type in detail. The benefit being, that the Facebook algorithm is taken into account while you avoid being overwhelmed by information.
For our example we picked picture posts. At the same time, the interval was set to only one hour to get as detailed as it can get. Now you get to comparing:
Pictures are posted especially thursdays around noon – but there is one slot that gets the best results compared to the other. Sometimes right at lunch isn’t the best time to post, but shortly before – or after. Of course it also always depends on your own fans, how many of them you have and the relevance of your content.
What helps with increasing the performance of your own posts is a detailed analyses.
“Wait, I’m forgetting something” – the bigger picture approach.
Yes, you thought this article was over already. That is not the case. One thing has to be mentioned: up until now we mostly talked about Facebook fanpages. But that is as if you were talking about pork and only mentioning bacon. Pork chops are well-loved, too. It’s the same with social media. Facebook is great, but Twitter is awesome, too. So here you go, a short dip into the world of timing on other networks:
Looking at the bigger picture pays off. Sadly, the data that we can access from Twitter is restricted, but looking at your competitors and analyzing your own posting habits go a long way to optimize your timing.
Do you use the Times & Types feature as extensively as we do? Or do you have other tricks? Let us know in the comments!
Try out the analyses right now!
Article Header by becosky under CC BY-SA 2.0 license
