We admit that we did not give LinkedIn the attention it deserves, so far. From now on you can compare and analyze all company profiles of the platform in Analytics.

Analyses
To get a quick overview of all KPIs that are important to you you can create dashboards of LinkedIn Profiles. The number of profiles that can be added is limitless. This way you are able to compare easily and determine average values.
On top of this, you will gather useful information to up your content strategy on LinkedIn by finding out what kind of posts engaged the users most. You will learn what the top and flop posts were, what post types and keywords worked best and much more.
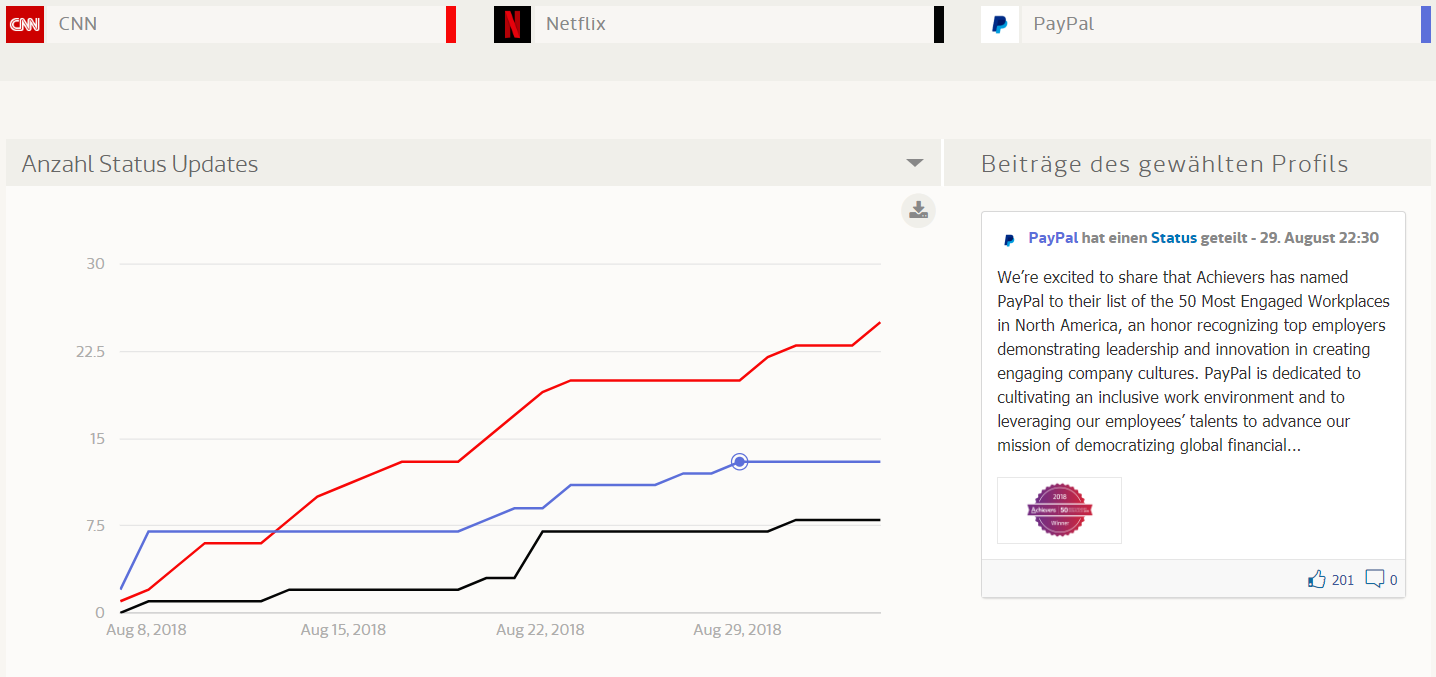
For visual presentation of data you can create graphs that show the development of the chosen profiles in chosen time periods. All analyses can be exported (Excel, PowerPoint, pdf).
These are our LinkedIn Indicators
The following KPIs are available for public company profiles:
Follower
- Follower
Status Updates (Posts)
- Number of Status Updates
- Status Updates per day
Theses KPIs are characterising events on updates from the choosen time period. For instance, a like given on friday at an update from monday will be counted for monday:
- Likes on status updates of time period
- Comments on status updates of time period
- Comments and Likes on updates of time period
- Likes per status update of time period
- Comments per status update of time period
- Engagement on status updates of time period
- Interaction on status updates of time period (in %)
- Profile Performance Index (The PPI shows how many interactions happen on a profile, how engaged the followers are and how fast a profile is growing. The higher it is, the better.)
Growth
- Growth (absolute)
- Follower Growth (weekly, in %)
- Growth rate
- Percentage increase since starting point
More KPIs with Insights
In addition to the above, as an admin of a LinkedIn Company you have access to the following indicators:
- Follower (organic)
- Follower (paid)
Actions in Time Period
These KPIs are characterizing events, which directly take place in the chosen time period:
- Likes in time period
- Comments in time period
- Shares in time period
- Clicks in time period (number of clicks on the content, the company name, or the company logo)
- Impressions in time period (shows how many times your updates were seen, both organically and through paid campaigns, on a daily basis)
- Unique impressions per day in time period (shows how many LinkedIn Members have seen your updates, both organically and through paid campaigns, on a daily basis (not counting recurrent visits to updates)
- Engagement per day in time period
Jobs
Most KPIs are about status updates. The following KPIs are about Job updates:
- Number of job updates
- Job updates per day
- Number of status & job updates
- Status & job updates per day
Start analyzing LinkedIn Companies now: www.fanpagekarma.com
